Auto Sales On Pace For New Expansion High Early in December Reporting
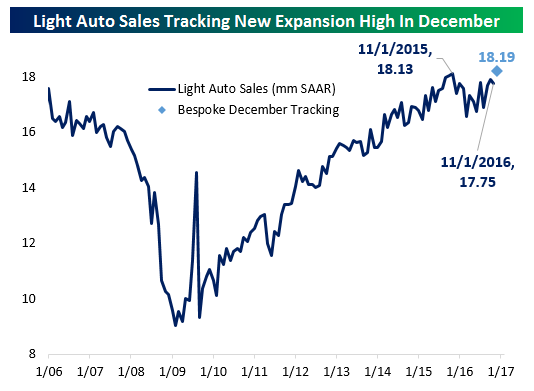
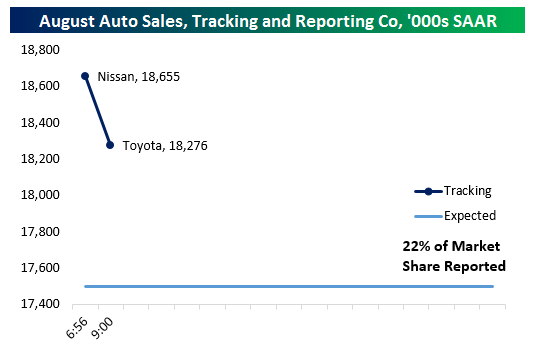
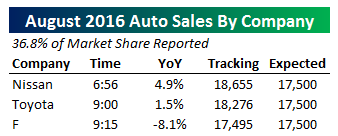 We’ve only got reports from three major US automakers and that equates to 41% of the industry reported but with those figures December looks to have been a strong month for US auto sales. With Nissan, GM, and Ford reported, we’re tracking a sales pace north of 18.9mm on a seasonally adjusted, annual rate basis. That sales pace is not likely to be matched by every other reporting company, but as things stand currently the industry is on pace to exceed the November, 2015 peak sales rate of 18.13mm SAAR. As shown at right, all three reporting companies saw higher sales on a YoY basis which does not adjust for seasonality or trading days. Analysts had been expecting both Nissan and Ford to record NSA YoY declines. The current 18.9mm SAAR pace we’re tracking is nearly 1.2mm SAAR better than analyst expectations. As usual, we’ll continue to update both the table at right and charts below throughout the day as more companies report.
Update 1 10:52 AM: With 70% of the market reported across six manufacturers (including the four largest: Toyota, GM, Ford, and Fiat-Chrysler) December auto sales are still tracking a healthy beat versus estimated sales of 17.7mm SAAR and 17.75mm SAAR last month. However, they’re much at the current pace we’re tracking than the booming 19mm sales pace suggested by the early reports from Nissan and GM. One huge winner on the day that wouldn’t have been easy predict earlier this year: Volkswagen. Sales are up over 20% YoY as the company recovers from its emissions scandal.
Update 2 11:52 AM: We’ve seen a few more small manufacturers report since our last updated and with a bit more than 73% of them market reported we’re now up to 18.23mm SAAR on our tracker. Strong gains from Audi YoY pushed sales there up by over 13% from a year ago while declines for Mazda were smaller than estimated.
Update 3 1:43 PM: Since our last update we’ve gotten reports from Honda, Porsche, Mitsubishi, BMW, Kia and Subaru, representing another 20% of the total US auto market. We’ve now got reports from over 93% of the market with only Mercedes and Hyundai outstanding. Subaru continued to gain market share with an impressive year-over-year double-digit sales improvement. Honda also delivered a strong report. On net, there’s been a little improvement in the tracker since the last update and auto sales look set to reach 18.23mm per our math. As a reminder, that’s better than the 18.13mm SAAR recorded in November of last year. That month is the current high water mark for the current expansion. While we won’t see the explosion higher in sales that we were tracking after strong Nissan and GM reports, December looks to be a solid month and a new expansion high nonetheless.
Final Update 3:23 PM: As shown below, with 99% of the market reported, auto sales made a new expansion high in the month of December. As indicated in the table above right, Wards Auto has a slightly higher estimate. Either way, however, the previous 18.13mm highwater mark from 13 months ago has now fallen. That’s significantly stronger than the 17.7mm SAAR estimated by economists entering reporting today.
The Closer – 1/3/17 – PMIs Much Improved
Log-in here if you’re a member with access to the Closer.
Looking for deeper insight on global markets and economics? In tonight’s Closer sent to Bespoke Institutional clients, we take a look at some of the major Manufacturing PMI readings for December.

The Closer is one of our most popular reports, and you can see it and everything else Bespoke publishes by starting a no-obligation 14-day free trial to our research!
Stock Seasonality Report: 1/3/17
Chart of the Day – Poor Technicals For Emerging Markets
Economic Data Kicks Off 2017 on a Positive Note
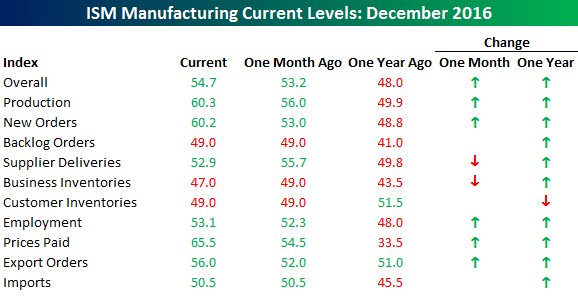
While it has been a relatively quiet US economic calendar to kick off the New Year, the data we did get was better than expected. The most notable of them all was the ISM Manufacturing report for the month of December. Economists were expecting a headline reading of 53.8, but the actual reading came in notably higher at 54.7, which was the highest level in exactly two years.
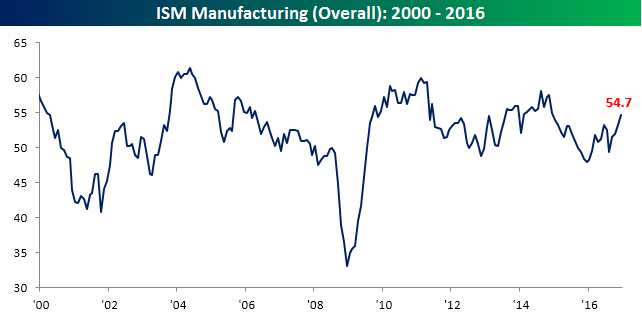
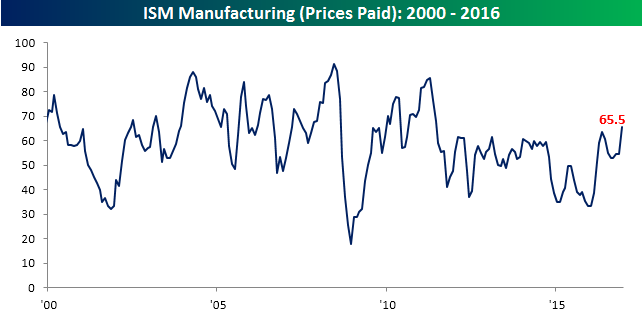
Not only was the headline reading strong, but the internals were also mostly to the upside. On a month/month basis, just two components declined, while on a year/year basis only one component declined. The biggest gainers this month were Prices Paid, New Orders, and Production. In the case of Prices Paid, that index rose 11 points to 65.5, which was the highest monthly reading since June 2011 (chart below). While the 11-point increase was large, we saw an even larger one-month increase back in March when the Prices Paid component surged 13 points.
Like what you see? Click here to gain full access to Bespoke and our 2017 outlook report.
Bespoke CNBC Appearance (12/30/16)
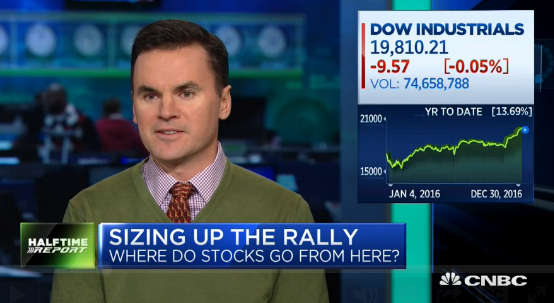
Bespoke co-founder Paul Hickey appeared on CNBC’s Fast Money Halftime to discuss markets and our outlook for 2017. To view the segment, please click on the image below.
Like what you see? Click here to gain full access to Bespoke and our 2017 outlook report.
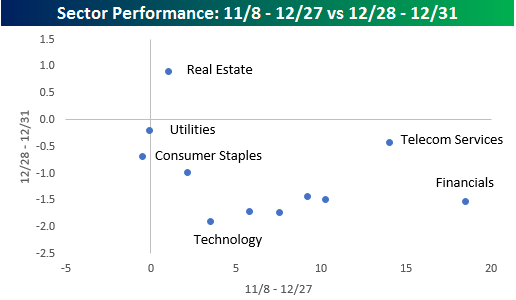
Sector Performance During Three Day Sell-Off
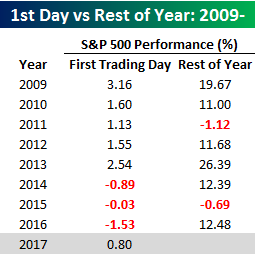 2016 may have gone out like a bear, but 2017 is kicking off bullish. US equities are beginning the year in the green, looking to end what was a three-day losing streak for the S&P 500, DJIA, and Nasdaq to close out 2016; the first such streak since the start of November. So just when you thought they couldn’t go down anymore, the last three days of 2016 served as a reminder that equity performance is in fact a two-way street. But today, the direction is back up as the S&P 500 is set for its first positive day to start a year since 2013.
Looking at sector returns during the last three days of the year, it looked like nothing more than profit-taking as the market’s leading sector (Financials) during the rally was among the laggards, while the three sectors that held up the best were among the biggest laggards during the rally. One sector that stands out is Telecom Services; while it was the second best performing sector during the rally, it was the third best performing sector in the last three trading days of 2016. With just five stocks in the sector, though, we have probably already wasted more than enough ink talking about it.
One significant sector worth talking about, though, is Technology. With a gain of 3.5% post-election, through 12/27, the sector fell close to 2% in the last three days of the year, erasing more than half of its post-election gains. Since the close on 11/8, the only three sectors that have done worse are Consumer Staples (-1.2%), Utilities (-0.27%), and Health Care (1.2%).
Like what you see? Click here to gain full access to Bespoke and our 2017 outlook report.
The Bespoke Report — 2017 Annual Outlook
 Our 2017 Bespoke Report market outlook is the most important piece of research that Bespoke publishes each year. We’ve been publishing our annual outlook piece since the formation of Bespoke in 2007, and it gets better and better each year! In this year’s edition, we cover every important topic you can think of dealing with financial markets as we enter 2017. And to say that 2017 should be an interesting year for asset classes would be an understatement given the huge rotation we’ve already seen in just a few weeks since the Presidential Election was held back on November 8th.
The 2017 Bespoke Report contains sections like Washington and Markets, Economic Cycles, Market Cycles, Sector Technicals and Weightings, Stock Market Sentiment, Stock Market Seasonality, Housing, Commodities, and more.
To view our 2017 Bespoke Report annual outlook, simply sign up for a 30-day free trial to Bespoke Premium. It’s that easy!
Bespoke’s Trump Stock Portfolio for 2017
With the new Trump administration set to take control of the Executive Branch on January 20th, 2017, we thought we’d publish a list of stocks that we think have a chance to benefit the most from the “Trump trade” in 2017. While we have a relatively neutral view on the market (and the Trump trade) entering the new year, if you’re fully on board, these are the names that we’d expect to do best. There are 43 names on the list, so it’s tough to just do a sweep buy of each individual name since each one has an equal weighting of just 2.3%. (Anyone want to make an ETF with us?) Instead, we recommend looking through each of the names and seeing if any pique your interest. Each name fits within broad boundaries of what we think will benefit from Trump’s stated policy goals, though try as we did, we couldn’t think of any public companies that actually drain swamps!
To view the Trump portfolio and our 2017 Outlook report, please start a 30 day trial to Bespoke Premium.
Bespoke Brunch Reads: 1/1/17
Happy New Years and welcome to Bespoke Brunch Reads — a linkfest of the favorite things we read over the past week. The links are mostly market related, but there are some other interesting subjects covered as well. We hope you enjoy the food for thought as a supplement to the research we provide you during the week.
Hedge Funds
Hedge Fund Math: Heads We Win, Tails You Lose by James B. Stewart (NYT)
A look inside the math of big revenues despite underperformance for hedge funds. [Link; soft paywall]
Trump’s Treasury Pick Moves in Secretive Hedge Fund Circles by Matthew Goldstein and Alexandra Steveson (NYT)
We’re confused: is being a Goldman Sachs alum a plutocratic non-starter for a cabinet position, or is the right angle “Mnuchin wasn’t that famous as a Goldman Sachs guy, and probably not even as a hedge fund guy, so why is he there?” We’ll let you make the call. [Link; soft paywall]
Amazon
Amazon wins patent for a flying warehouse that will deploy drones to deliver parcels in minutes by Arjun Kharpal (CNBC)
Who knows whether this new patent will come to anything – the US Patent Office literally floats on a sea of ideas that never came to fruition – but the idea of flying warehouses is certainly attention-grabbing! [Link; auto-playing video]
Want an Amazon Echo for Christmas? Sorry, it’s sold out by Stan Schroeder (Mashable)
Both the Echo and its smaller Echo Dot sister device were in high demand this holiday season, as the speakers become one of the more successful hardware efforts the company has come up with. [Link]
Fun With Hardware
From Tape Drives to Memory Orbs, the Data Formats of Star Wars Suck (Spoilers) by Sarah Jeong (Motherboard)
A hilarious look at the plethora of storage devices used to move around plans for the Death Star. [Link]
Real Estate
House Flipping Makes a Comeback as Home Prices Rise by Kirsten Grind and Peter Rudegeair (WSJ)
While it hasn’t come close to the heights reached in the mid-2000s, rising home prices and demand for housing stock has made the buy, renovate, and move on popular – and profitable – again. [Link; paywall]
A Storm Brewing on the Apartment Horizon by Mark Hickey (CoStar Group)
While single family home demand is doing great things (see the story above!), apartments are starting to enter a period of structural low demand driven by demographics. [Link]
Economic Musings
Why historians would make bad policy advisers by Neville Morley (Aeon)
While history can often be a guide to current events – and has a funny habit of repeating – Dresser argues that the human element is far more important than the abstract “laws” of history. [Link]
The emptiness of life will save us from mass unemployment (Pseudoerasmus)
A succinct and digestible argument that despite fears of machine-driven mass unemployment, there will always be demand for human labor. [Link]
The “Lucky 13” States and the Challenges of Geographically Concentrated Growth by Adam Carstens (Medium)
Summarizing the combination of geography and demographics that are currently bestowing growth on a relatively small portion of US with major tailwinds, Carstens also offers some possible solutions for the headwinds facing the rest of the country. [Link]
Long Reads
Our Favorite Wired Longreads of the Year by Charley Locke (Wired)
VR, AI, streaming, memory, robot velociraptors, ISIS social media strategy, old observatories, lead water, teens on the internet, the end of movies, terrible first seasons, pun competitions, the President on tech, graphic design, and the Dallas Police Department: 15 long reads for the year that was. [Link]
The Manhattan Cocktail: A Complete Guide to Its Myths and Mixology by Troy Patterson (Bloomberg)
A long meandering stroll down the road of whiskey, vermouth, and bitters that combine into what is still, in our opinion, a very underrated cocktail. [Link]
A Bigger Problem Than ISIS? by Dexter Filkins (The New Yorker)
When you start using billions of cubic meters and millions of acre-feet to describe volumes of water, you know you’re operating on a pretty ridiculous scale. That’s the sort of threat that’s sitting behind an aging bank of concrete in northern Iraq. [Link]
Business In America
Big Growth in Tiny Businesses by Jeffrey Sparshott (WSJ)
The ranks of manufacturers with no employees have swollen by 17% over the last decade, driven by surging demand for “craft” and “quaint” products that command a premium. [Link; paywall]
Democracy
The Toughest Death of 2016: the Democratic Norms That (Used to) Guide Our Political System by Seth Masket (Pacific Standard)
In the long run, the only real problem with 2016 might have been the damage done to norms that have served our republic well for the past two centuries. [Link]