The Closer 1/6/17 – End of Week Charts
Looking for deeper insight on global markets and economics? In tonight’s Closer sent to Bespoke clients, we recap weekly price action in major asset classes, update economic surprise index data for major economies, chart the weekly Commitment of Traders report from the CFTC, and provide our normal nightly update on ETF performance, volume and price movers, and the Bespoke Market Timing Model.

The Closer is one of our most popular reports, and you can sign up for a trial below to see it and everything else Bespoke publishes free for the next two weeks!
Click here to start your no-obligation free Bespoke research trial now!
Quick View Chart Book – 1/6/17
Consumer Pulse – Personal Finances
Each month, Bespoke runs a survey of 1,500 US consumers balanced to the demographic weights tracked by the US Census. In the survey, we cover everything you can think of regarding the economy, personal finances, and consumer spending habits. We’ve now been running the monthly survey for more than two years, so we have historical trend data that is extremely valuable, and it only gets more valuable as time passes. All of this data gets packaged into our monthly Bespoke Consumer Pulse Report, which is included as part of our Pulse subscription package that is available for either $39/month or $365/year. We highly recommend trying out the service, as it includes access to model portfolios and additional consumer reports as well. If you’re not yet a Pulse member, click here to start a 30-day free trial now!
Below are charts from our most recent survey (covering the month of December) regarding personal finances. We asked consumers to tell us how they feel about their personal financial situation today, versus last year and also versus the average person. As you can see, since the election, the US consumer is significantly more comfortable with their personal financial position now as well as compared to how they felt last year. You should keep this information handy for next time you hear a CEO or CFO of a struggling retailer tell how “challenging the retail environment” is. It may be challenging, but it’s definitely not because of the consumer!

Bespoke Earnings Estimate Revisions: 1/6/16
Death By Amazon – January 2017
Following brutal reports from a few different department stores this week, we mentioned our Death By Amazon Index in a blog post yesterday. Today, we updated that index in one of our B.I.G. Tips reports. Below we chart the performance of the index versus Amazon (AMZN) and the S&P 1500.
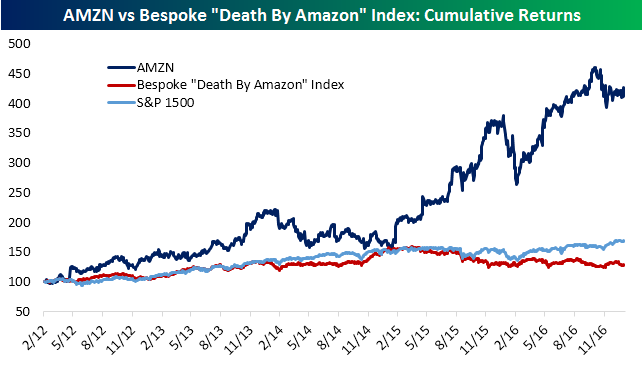
To see the report, which includes more information about the construction of the Death By Amazon Index, its performance, and the stocks that make up the index sign up for a monthly Bespoke Premium membership.
ETF Trends: US Indices & Styles – 1/6/17
Gold miners have outperformed over the past week, with Biotech, oil services, and a few EM names also doing quite well. Not all of EM has rallied over the past week, however. Turkey and Mexico are two of the weakest performers over the past five sessions, with Turkey drastically underperforming thanks in large part to chaos in USDTRY. Natural gas has also gotten pounded by weather shifts, while the USD has delivered a pretty weak showing, especially in the last two days.

Bespoke provides Bespoke Premium and Bespoke Institutional members with a daily ETF Trends report that highlights proprietary trend and timing scores for more than 200 widely followed ETFs across all asset classes. If you’re an ETF investor, this daily report is perfect. Sign up below to access today’s ETF Trends report.
See Bespoke’s full daily ETF Trends report by starting a no-obligation free trial to our premium research. Click here to sign up with just your name and email address.
The Closer 1/5/17 – Are Trump Trades Still Intact?
Log-in here if you’re a member with access to the Closer.
Looking for deeper insight on global markets and economics? In tonight’s Closer sent to Bespoke Institutional clients, we update our tracking of US crude oil inventories and production as well as checking in on the performance of post-election Trump trades.
The Closer is one of our most popular reports, and you can see it and everything else Bespoke publishes by starting a no-obligation 14-day free trial to our research!
Death By Amazon Lives Up to its Name
Get Bespoke’s 2017 Outlook Report with a 30-day free trial to Bespoke’s premium research! Click here to learn more.
With big blowups from Kohl’s (KSS) and Macy’s (M), it was a bloodbath for retail related stocks today. A perfect illustration of this weakness was the performance of our Death By Amazon Index. Bespoke’s “Death By Amazon” index was created in 2014 as a way to track the performance of the companies most affected by the rise of Amazon.com (AMZN). Companies included must be direct retailers with a limited online presence (or core business based on physical retailing locations), a member of either the Retail industry of the S&P 1500 Index or a member of the S&P Retail Select Index, and rely on third party brands. We view these attributes as the best expression of Amazon’s threat to traditional retail.
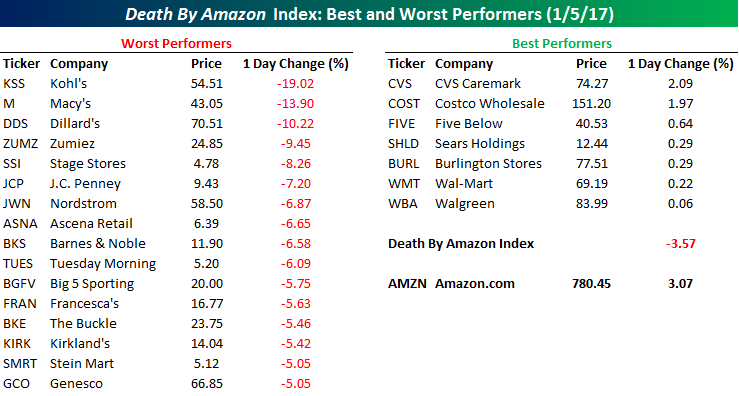
Of the 54 stocks that currently make up the index, all but seven were down today, and the average return of the 54 stocks was a decline of 3.57%. The table below lists the best (stocks that were up) and worst (stocks down 5%+) performing components of the index in Thursday’s trading. Leading the way to the downside were KSS and M, which proved today why they were included in the index in the first place! Other big losers included Dillard’s (DDS), J.C. Penney (JCP), and Nordstrom (JWN). On the upside, the only two stocks that were up more than 1% on the day were CVS Caremark (CVS) and Costco (COST). Meanwhile, while the Death By Amazon Index sank today, Amazon’s stock feasted on the weakness, rising 3.07%.
To gain access to our “Death by Amazon” index with monthly updates, sign up for a Premium or Institutional membership at our Products page now.
Bespoke’s Consumer Pulse Report — December 2016
Bespoke’s Consumer Pulse Report is an analysis of a huge consumer survey that we run each month. Our goal with this survey is to track trends across the economic and financial landscape in the US. Using the results from our proprietary monthly survey, we dissect and analyze all of the data and publish the Consumer Pulse Report, which we sell access to on a subscription basis. Sign up for a 30-day free trial to our Bespoke Consumer Pulse subscription service here. With a trial, you’ll get coverage of consumer electronics, social media, streaming media, retail, autos, and much more.

Bespoke’s Sector Snapshot — 1/5/17
We’ve just released our weekly Sector Snapshot report (see a sample here) for Bespoke Premium and Bespoke Institutional members. Please log-in here to view the report if you’re already a member. If you’re not yet a subscriber and would like to see the report, please start a 14-day trial to Bespoke Premium now.
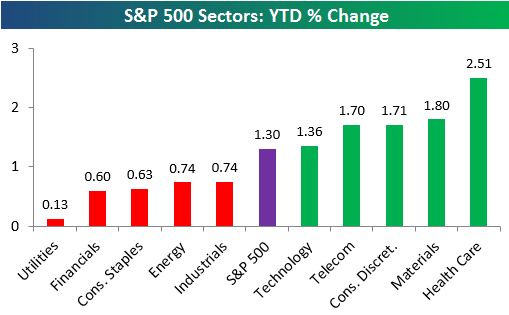
Below is one of the many charts included in this week’s Sector Snapshot, which simply highlights the year-to-date returns so far for the major S&P 500 sectors. In 2016, Health Care was by far the worst performing sector, but it has been the best so far this year. Financials and Energy, on the other hand, were two of the top sectors in 2016, but they’ve underperformed over the first few days of 2017.
To see our full Sector Snapshot with additional commentary plus six pages of charts that include analysis of valuations, breadth, technicals, and relative strength, start a 14-day free trial to our Bespoke Premium package now. Here’s a breakdown of the products you’ll receive.