Short Interest Report: 1/12/17
Chart of the Day: Insulation On Sale
ETF Trends: Fixed Income, Currencies, and Commodities – 1/12/17
Metals prices have surged with the broad European Stoxx 600 seeing its Basic Resources (miners) sector rise more than 1% each of the last four days; that’s with DBB up 5% and strong performances for iron ore and copper. Steel Producers, South Africa, and Brazil have benefited. A weaker dollar has helped support gold, as well as broad swathes of EM. Over the last week, however, Mexico remains one of the worst performing ETFs while oil producers are down significantly over five sessions despite an oil rally in the last two. Pharma has also underperformed.

Bespoke provides Bespoke Premium and Bespoke Institutional members with a daily ETF Trends report that highlights proprietary trend and timing scores for more than 200 widely followed ETFs across all asset classes. If you’re an ETF investor, this daily report is perfect. Sign up below to access today’s ETF Trends report.
See Bespoke’s full daily ETF Trends report by starting a no-obligation free trial to our premium research. Click here to sign up with just your name and email address.
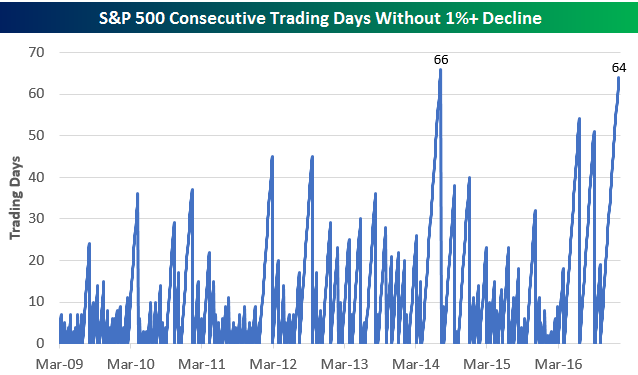
64 Trading Days Without a 1%+ Decline
Get Bespoke’s 2017 Outlook Report with a 30-day free trial to Bespoke’s premium research! Click here to learn more.
The S&P 500 is currently down 0.80% as we approach mid-day. Could this be the day that we finally see a 1%+ decline? The last time the S&P 500 fell more than 1% was back on October 11th when the index dropped 1.24%. The current 64-trading day streak without a 1%+ decline is the second longest of the current bull market which began in March 2009. The longest such streak of the bull market lasted 66 trading days from April through July of 2014. Going all the way back to 1928 when the S&P 500 began, there have only been 29 longer streaks without a 1%+ decline than the current one. When we finally do get another 1%+ decline (maybe today), we’ll be sure to provide clients with a look at how the market has historically performed in the days and weeks following the day that the streak is broken.
the Bespoke 50 — 1/12/17
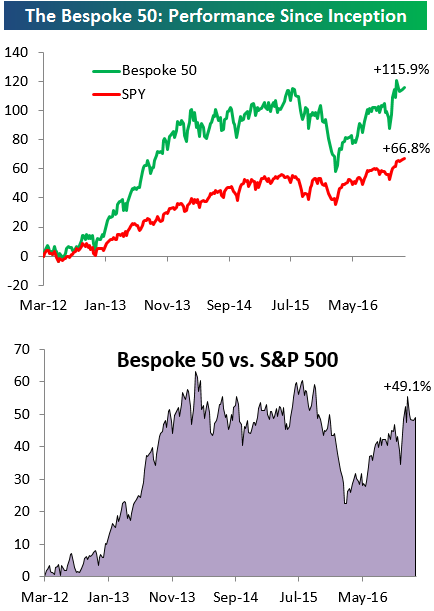
Every Thursday, Bespoke publishes its “Bespoke 50” list of top growth stocks in the Russell 3,000. Our “Bespoke 50” portfolio is made up of the 50 stocks that fit a proprietary growth screen that we created a number of years ago. Since inception in early 2012, the “Bespoke 50” has nearly doubled the performance of the S&P 500. Through today, the “Bespoke 50” is up 115.9% since inception versus the S&P 500’s gain of 66.8%.
To view our “Bespoke 50” list of top growth stocks, sign up for Bespoke Premium ($99/month) at this checkout page and get your first month free. This is a great deal!
106 Weeks and Counting
Get Bespoke’s 2017 Outlook Report with a 30-day free trial to Bespoke’s premium research! Click here to learn more.
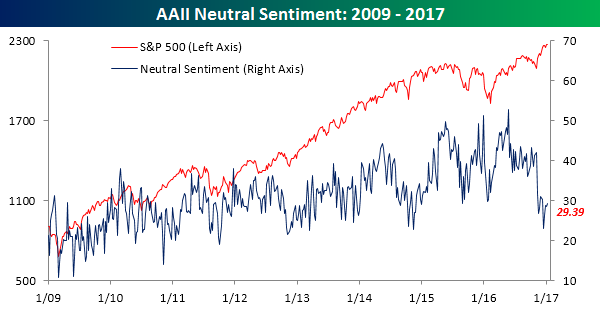
The streak goes on. Despite new all-time highs in the major equity benchmarks and the DJIA getting within half a point of 20,000, individual investors still can’t get to a majority in the bullish camp. According to this week’s survey from AAII, bullish sentiment dropped by about two and a half points in the latest week, falling from 46.20% down to 43.64%. That’s actually the lowest level since early December and shows that just like the overall consolidation we have seen in the market in the last several weeks, sentiment has also taken a breather. For the sake of reference, if bullish sentiment goes another five weeks without reaching 50%, it will be the longest streak of sub-50% readings in the history of the survey.
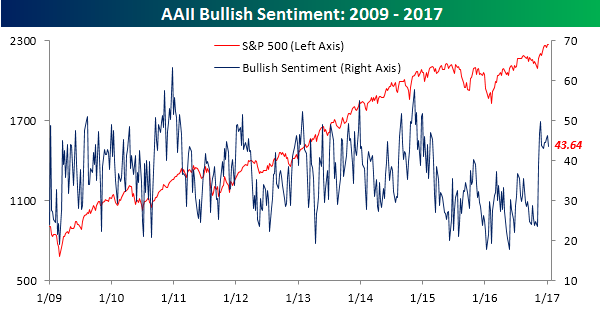
Although bulls aren’t in the majority, they do have a clear plurality. As shown in the charts below, bearish sentiment remains relatively low at 26.97%, while neutral sentiment is still under 30%. We would also note that this is a big change from the first half of 2016, when neutral sentiment was the leader with weekly readings routinely above 40%.

The Closer 1/11/17 – Fresh Year For Oil Inventories
Log-in here if you’re a member with access to the Closer.
Looking for deeper insight on global markets and economics? In tonight’s Closer sent to Bespoke Institutional clients, we take a look at oil supply and demand as revealed by this morning’s petroleum market report from the EIA.

The Closer is one of our most popular reports, and you can see it and everything else Bespoke publishes by starting a no-obligation 14-day free trial to our research!
Checking Up on Sector Breadth Levels
Get Bespoke’s 2017 Outlook Report with a 30-day free trial to Bespoke’s premium research! Click here to learn more.
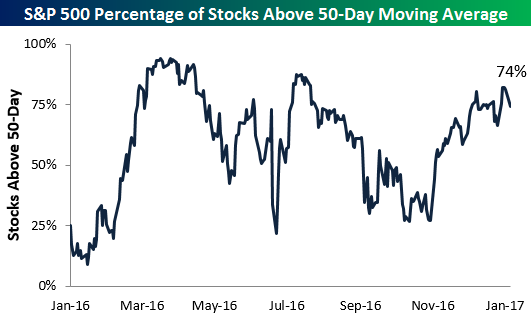
Below is a chart included in our weekly Sector Snapshot sent to Bespoke subscribers. It’s a breadth measure that shows the percentage of stocks in the S&P 500 that are trading above their 50-day moving averages. As shown, 74% of the S&P’s current members are now above their 50-days. That’s down slightly from a reading of 77% hit a few days ago, but as you can see, even though the S&P hit new all-time highs recently, this breadth measure didn’t reach a new high along with it. Even still, 74% is a very healthy reading and not one we’d be concerned about. If the S&P remains where it is and this measure starts to dip into the 50s and low-60s, it would be a negative divergence suggestive of lower prices.
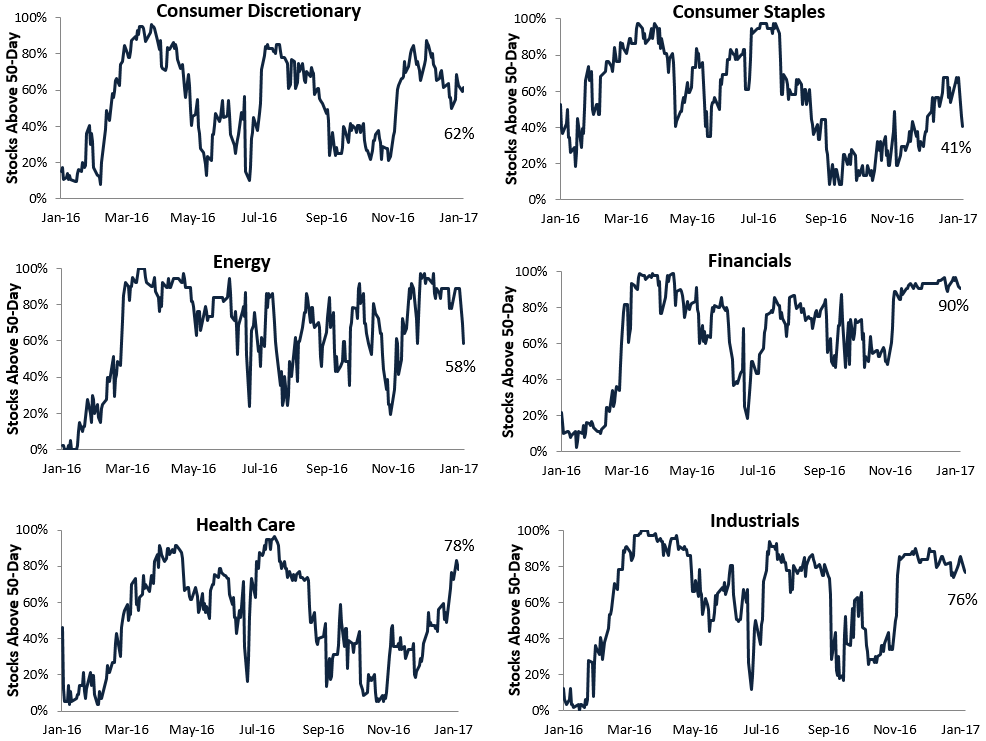
Below is a look at the percentage of stocks within each sector trading above their 50-day moving averages. Outside of Telecom (which only has a handful of stocks), the Financial sector currently has the strongest breadth reading at 90%. Technology — a sector that struggled initially after the election — ranks second at 85%, followed by Materials at 84%. Health Care breadth has also spiked quite significantly since the start of the year. One sector that has seen breadth dip recently is Energy. While Energy ran up right along with Financials in the weeks after the election, we’ve seen the two sectors diverge recently as oil prices have dipped. Right now 58% of Energy sector stocks are above their 50-days (versus 90% for Financials).
See these breadth charts weekly in our Sector Snapshot report. Choose either Bespoke Premium or Bespoke Institutional for immediate access.

Consumers Looking to Buy Big Ticket Items
Each month, Bespoke runs a survey of 1,500 US consumers balanced to census. In the survey, we cover everything you can think of regarding the economy, personal finances, and consumer spending habits. We’ve now been running the monthly survey for more than two years, so we have historical trend data that is extremely valuable, and it only gets more valuable as time passes. All of this data gets packaged into our monthly Bespoke Consumer Pulse Report, which is included as part of our Pulse subscription package that is available for either $39/month or $365/year. We highly recommend trying out the service, as it includes access to model portfolios and additional consumer reports as well. If you’re not yet a Pulse member, click here to start a 30-day free trial now!
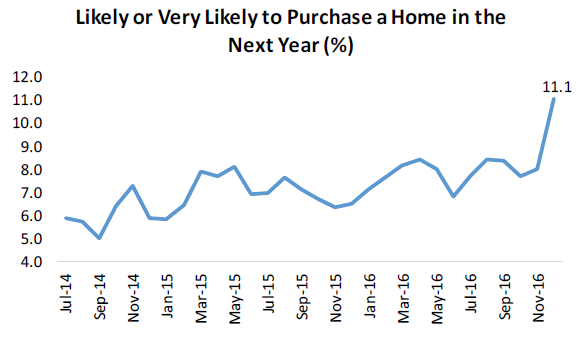
Continuing with the bullish theme we saw in a breakout month for our Consumer Pulse Report, the positive sentiment has consumers looking to spend on big ticket items. Of course the increase in income and feelings towards personal finances are a positive for consumer spending, but the intention to buy these big ticket items is also quite telling and a source for optimism. As you can see from the first chart below, survey respondents that are expecting to purchase a home in the next year jumped more than three points up to 11.1% in December, which is clearly a new high in our survey’s history.
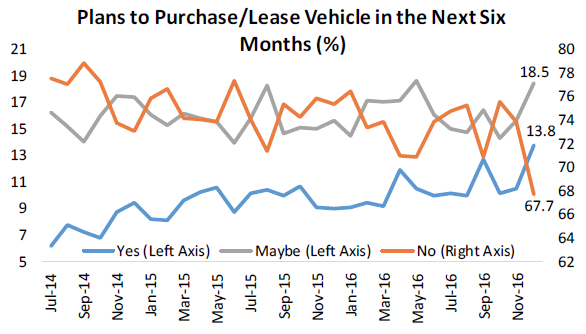
Along with new highs for home purchase expectations, our December Pulse survey also showed a spike in intentions to purchase a vehicle. One-third of respondents said either “yes” or “maybe” when we asked them if they plan on purchasing or leasing a vehicle in the next six months. That’s the highest reading we’ve seen in the three years we’ve been running our survey.
To see our full December Pulse report, click here to start a 30-day free trial now!
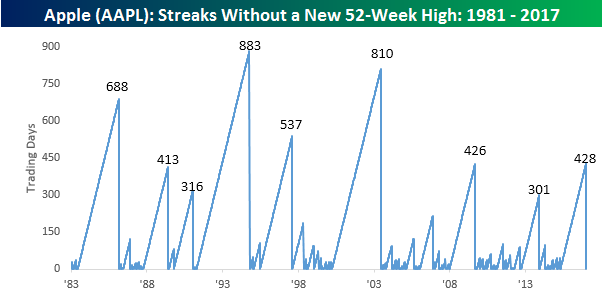
Apple (AAPL) Back on the 52-Week High List
Each day with our Morning Lineup, we include charts of each stock in the Russell 1000 hitting 52-week highs and lows in the prior day’s session. Back on Monday, one stock showed up on the list of new highs that hasn’t been on the list in quite some time. That stock was Apple (AAPL), and it did so just in time to celebrate the 10th anniversary of the iPhone. Even as the S&P 500 has hit multiple new all-time highs in the last several weeks, AAPL had been one stock that was conspicuously absent from the run to new highs. In fact, Monday’s new 52-week high for AAPL ended a streak of 428 trading days where the stock failed to hit a new one-year high. As shown in the chart below, that ranks as the ninth streak of a year or longer, the longest streak without a new high since 2003, and the fifth-longest streak since 1981.
So now that AAPL is back on the party bus, is the recent new high a sign of good things to come? In today’s Chart of the Day sent to Bespoke subscribers, we looked at each prior period where AAPL went a year or longer without hitting a 52-week high and then calculated how the stock performed in the period after the streak ended. See today’s Chart of the Day by starting a 14-day free trial to Bespoke’s premium research below.