Country 2017 Stock Market Returns
Learn more about Bespoke’s research and wealth management services.
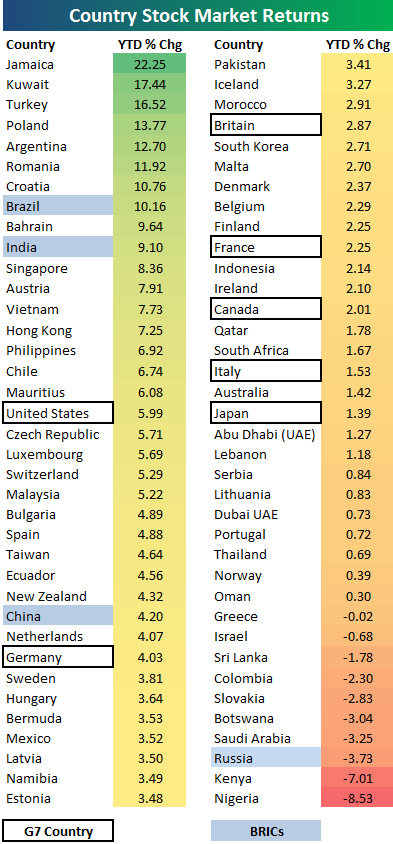
Heading into the US open this morning, the average country’s year-to-date stock market return (in local currency) stood at +3.9%, with 64 of the 74 countries shown in the table below in the green for the year. As shown, Jamaican stocks are leading the way with a 2017 gain of 22.25%. Kuwait and Turkey rank 2nd and 3rd with gains in excess of 15%.
Of the G7 countries, the US is up the most with a gain of 5.99%. Germany ranks second, followed by Britain and France. Japan has been the weakest of the G7 with a small gain of 1.39%.
Looking at the BRICs, Brazil is up the most with a gain of 10.16%, while Russia is performing the worst with a decline of 3.73%. Nigeria and Kenya are the two worst performing countries in the table with respective declines of 8.5% and 7%.
To see Bespoke’s full line of macro and micro research, sign up for one of our premium membership options today! You won’t be disappointed.
Bespoke Brunch Reads: 3/5/17
Welcome to Bespoke Brunch Reads — a linkfest of the favorite things we read over the past week. The links are mostly market related, but there are some other interesting subjects covered as well. We hope you enjoy the food for thought as a supplement to the research we provide you during the week.
International Affairs
Martin Schulz puts fire in the heart of Germany’s centre-left by Guy Chazan (FT)
A chronicle of the unlikely face of a rise in the moderate left in Germany, which has a chance to become the senior partner in the country’s grand coalition government. [Link; paywall]
North Korea Executes Five Senior Officials With Antiaircraft Guns by Joanthan Cheng and Kwanwoo Jun (WSJ)
Purges have been undertaken in the wake of the assassination of the dictator’s younger brother in Malaysia. Some of the details are spectacular and horrifying to say the very least. [Link; paywall]
Mystery deepens over Chinese forces in Afghanistan by Charles Clover (FT)
As China continues to expand its role as a global geopolitical force, there have been confusing reports of Chinese troops in Afghanistan. [Link; paywall]
Investors
How Snapchat’s first investor — whose stake is now worth $2 billion — found Snapchat when it had less than 100,000 users by Alyson Shontell (Business Insider)
When Snap was spreading entirely by word of mouth, Lightspeed Venture’s Jeremy Liew found out about it through his daughter. [Link]
Loeb Embraces Trump ‘Paradigm Shift,’ Says Stocks Not Overvalued by Sonali Basak, Simone Foxman, and Lisa Du (Bloomberg)
Third Point’s Loeb thinks broad policy change including tax reform justify the post-election rally and the S&P’s valuation; he added to Industrials and Financials after the elections while trimming TMT exposure. [Link]
Berkshire Hathaway Annual Shareholder Letter 2016 by Warren E. Buffett
While it’s overwhelmingly likely you’ve already come across the annual missive from Buffett elsewhere, we’re suckers for a Berkshire letter and they’re always worth at least a cursory read. [Link; 28 page PDF]
Science
Dying woolly mammoths were in ‘genetic meltdown’ by Brian Switek (Nature)
An interesting summary of new research which suggests woolly mammoths’ rapid extinction process was the result of bad genetics becoming dominant in the population. [Link]
What’s Stored in DNA? An Old French Movie and a $50 Gift Card by Robert Lee Hotz (WSJ)
Nature is mind-bendingly efficient, so it shouldn’t be all that great of a surprise that the oldest form of information storage (DNA) is so efficient that it could store the entire internet’s data in a single test tube. [Link; paywall]
Air Force doctor wins NASA “Space Poop Challenge” by Phillip Swarts (Space News)
More than 5,000 submissions resulted in a single choice from NASA in the enormous challenge of making astronaut waste disposal more efficient. [Link]
Productivity
Reinventing construction through a productivity revolution by Filipe Barbosa, Jonathan Woetzel, Jan Mischke, Maria Joao Ribeirinho, Mukund Sridhar, Matthew Parsons, Nick Bertram, and Stephanie Brow (McKinsey)
Construction is famed for its abysmal productivity, but McKinsey believes that the sector can deliver a $1.6 trillion boost to global output through changes in regulation and transparency, contracts, new design and engineering practices, better procurement and supply chain management, improved on-site execution, more technology, new materials, and advanced automation, and a reskilled workforce. [Link]
Wendy’s to install ordering kiosks in 1,000 stores this year by JD Malone (Columbus Dispatch)
Could services companies finally be moving towards the sort of productivity enhancements long-enjoyed by the manufacturing industry? New kiosks promise reduced staffing costs and a 3 year payback on investment for Wendy’s franchisees. [Link]
JPMorgan Software Does in Seconds What Took Lawyers 360,000 Hours by Hugh Son (Bloomberg)
Commercial loan agreements are now getting scrutiny from a new program at JPM which can save huge amounts of time for lawyers and huge amounts of money for the bank. [Link]
Strange News
An American man has taken out a huge ad in The Times claiming to be the rightful King of England by Alison Millington (Business Insider)
A Colorado man claims to be a descendent of the Welsh line of the British monarchy dating back to the third century. We aren’t too enthused with his chances. [Link]
Saudi king packs more than 500 tons of luggage for nine-day trip by Natalie Musumeci (NYPost)
What most people would be able to do with a carry-on and at most one checked bag resulted in a Herculean logistical effort for the leader of the House of Saud. [Link]
White Sox’s Jose Abreu to jury: I ate fake passport on way to U.S. by Paula McMahon (Chicago Tribune)
A very strange anecdote about the process Cuban baseball prospects go through to get to the United States. [Link]
This Week In Brands
Why Platinum Can’t Beat Sapphire by Aaron Back (WSJ)
The card wars continue as American Express loses ground to the wildly popular Sapphire offering from JP Morgan. [Link; paywall]
Pizza Hut made shoes that let you order pizza with a push of the tongue by James Dator (SB Nation)
Dominos boasts a feature that will deliver a specific order based on tweeting an emoji, but Pizza Hut couldn’t let that stand as the high bar in the “weird ways to order food” fight. [Link]
Dispatches From The Valley
How Uber Deceives the Authorities Worldwide by Mike Isaac (NYT)
Ridesharing app Uber developed a data tool to make it impossible for possible sting operations or other Terms of Service violators to actually order a ride. [link; soft paywall, auto-playing video]
How a classic math problem gave Reed Hastings the idea for Netflix by Arjun Kharpal (CNBC)
Last week we linked to an xkcd post discussing the bandwidth of a physical network; it turns out that a related math problem was the source of inspiration for the original DVD-by-mail service Netflix. [Link; auto-playing video]
Our Latest Update on Safety by Ed Ho (Twitter)
This week Twitter announced a series of common-sense features to reduce abuse and improve the user experience of Twitter. As avid users of the service, we think these are positive steps. [Link]
Not Great
FBI Lawyer Sting Rattles Billion-Dollar Whistle-Blower Unit by Kef Feeley, David Voreacos, and Neil Weinberg (Bloomberg)
A former Justice Department attorney is under investigation by the FBI for selling secrets around whistleblower lawsuits. [Link]
Data from connected CloudPets teddy bears leaked and ransomed, exposing kids’ voice messages by Troy Hunt (troyhunt.com)
An exhaustive catalogue of events related to the exposure of millions of messages from children to cloud-enable stuffed animals. Due to frankly terrible security practices, account data and therefore access to recordings made by the stuffed animals was wide open to anyone with internet access. [Link]
Broker Business
The Brokerage Firm CLSA Shuts Part of Its U.S. Business by Liz Moyer (NYT)
90 employees were shown the door as US equity research was shuttered earlier this week; included in the ranks was brash banks analyst Mike Mayo. [Link; soft paywall]
Markets
Another warning sign is popping up in the stock market by Jonathan Garber (Business Insider)
Equity bulls are keeping an eye on the long end of the curve, which has even famed equity bull Tom Lee of Fundstrat cautious. [Link]
Changing Demographics and State Tax Collections by Don Boyd (Nelson A. Rockefeller Institute of Government)
A review of the changes in revenue by source that will likely take place as populations age. [Link; 27 page PDF]
Have a great Sunday!
The Bespoke Report — “Sell The…”
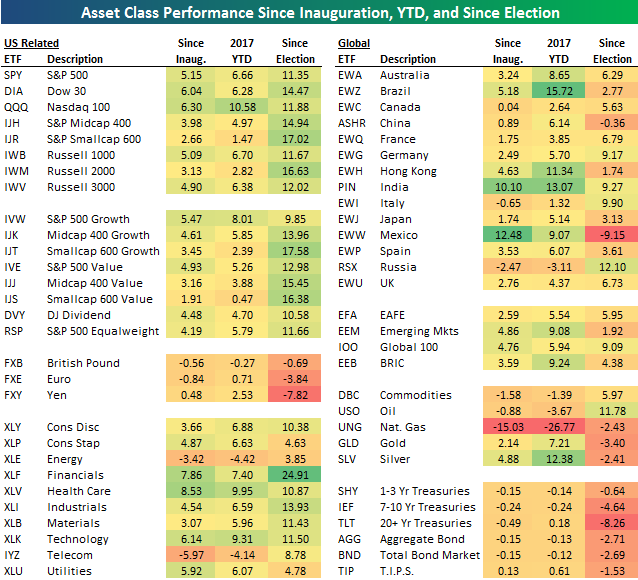
The screen below is one of many graphics included in our just-published Bespoke Report newsletter (included weekly with all of our membership packages). It shows the recent performance of various asset classes using our key ETF matrix. Note that every one of the major US index ETFs shown in the first section of the left column is now up 10%+ since the election last November. The Financial sector (XLF) is now up 24.91%, which is the best ETF in the entire matrix.
If you’d like to read our thoughts on recent performance plus the rest of this week’s Bespoke Report newsletter, take advantage of our one-month Bespoke Premium free trial offer. Sign up now at this page.
Have a great weekend!
The Closer 3/3/17 – End of Week Charts
Looking for deeper insight on global markets and economics? In tonight’s Closer sent to Bespoke clients, we recap weekly price action in major asset classes, update economic surprise index data for major economies, chart the weekly Commitment of Traders report from the CFTC, and provide our normal nightly update on ETF performance, volume and price movers, and the Bespoke Market Timing Model.

The Closer is one of our most popular reports, and you can sign up for a trial below to see it and everything else Bespoke publishes free for the next two weeks!
Click here to start your no-obligation free Bespoke research trial now!
ETF Trends: International – 3/3/17
Biotech was the best performer within the US equity market this week but the real stars were European equities: Italy, Spain, the Euro Stoxx 50, and France all leaped despite a weaker euro. Financials and homebuilders also performed well. The worst performers were gold miners, silver, and long-term Treasuries as rates rose and commodities declined.

Bespoke provides Bespoke Premium and Bespoke Institutional members with a daily ETF Trends report that highlights proprietary trend and timing scores for more than 200 widely followed ETFs across all asset classes. If you’re an ETF investor, this daily report is perfect. Sign up below to access today’s ETF Trends report.
See Bespoke’s full daily ETF Trends report by starting a no-obligation free trial to our premium research. Click here to sign up with just your name and email address.
ISM Commodities Survey Shows Rising Commodity Prices
Learn more about Bespoke’s research and wealth management services.
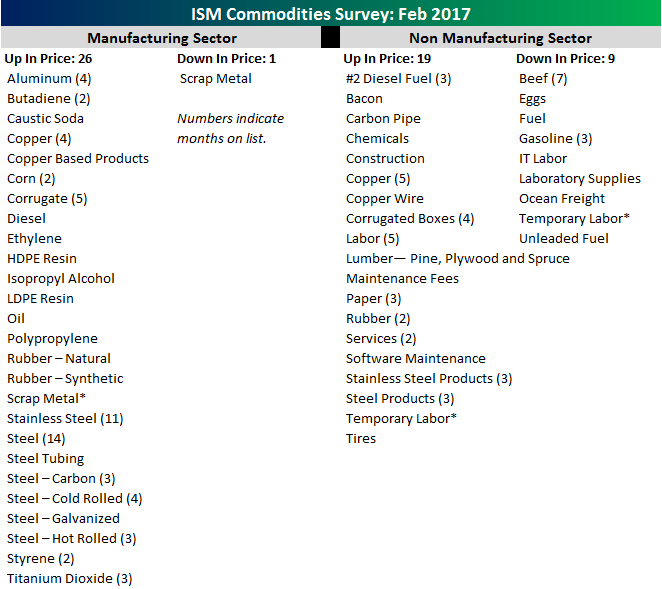
With both the Manufacturing and Non-Manufacturing ISM reports coming in better than expected this week, there were definitely a number of bright spots in this week’s calendar of economic data. While both reports showed strength, they also showed a pickup in the number of commodities rising in price. The table below shows the number of commodities cited by respondents as both rising and falling in price in each of the ISM reports. In the Manufacturing sector, respondents noted price increases in 26 commodities, which was the highest for a single month since May 2011, and up four from January. While 26 commodities were up in price, just one commodity was down in price (Scrap Metal). In the Non-Manufacturing sector, 19 commodities were reported as being up in price (highest since July 2014), while nine were down in price (highest since February 2016).
On a combined basis, 45 commodities were up in price, which was the highest since April 2012, while just ten were down. As shown in the chart, the three-month average of our commodities survey tends to track changes in inflation over time, and February’s increase in the number of commodities rising in price brought the moving average up to 29.7. That was the largest one-month increase since May 2016, taking the three-month moving average up to its highest point since June 2014 and confirming the uptick in y/y inflation to 2.5%- the highest level since March 2012.
To see Bespoke’s full line of macro and micro research, sign up for one of our premium membership options today! You won’t be disappointed.

Bespoke’s Quick-View Chart Book- 3/3/17
Services Sector Keeps on Trucking
Learn more about Bespoke’s research and wealth management services.
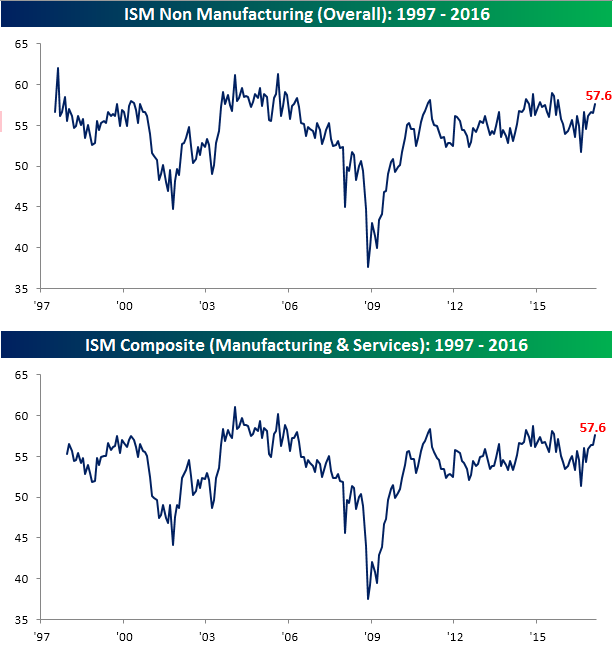
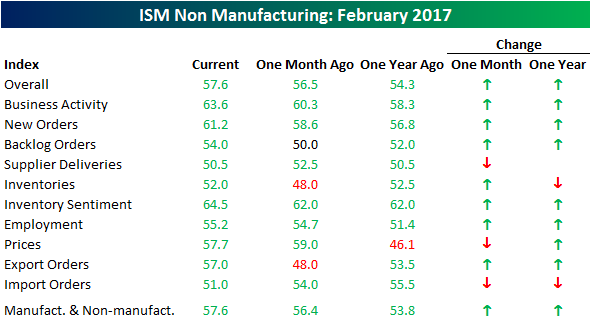
Activity in the services sector continued to accelerate during the month of February as the ISM Non-Manufacturing report rose from 56.5 up to 57.6 and ahead of expectations for a reading of 56.5. February’s reading was the third m/m increase in the last four months, taking the index to its highest level since October 2015. On a combined basis and accounting for each sector’s weight in the overall economy, the ISM reading for February also came in at 57.6, which was the best reading since August 2015.
The table below breaks down this month’s ISM Non Manufacturing report by each of the index’s components. On both a m/m and a y/y basis, breadth in this month’s report was solid. In this month’s report, all ten categories moved back into growth mode (>50) with the biggest m/m increases coming in Export Orders, Inventories, and Backlog Orders. To the downside, Import Orders, Supplier Deliveries, and Prices all declined relative to January. On a y/y basis, Prices Paid is up the most of any components, followed by Business Activity, New Orders.
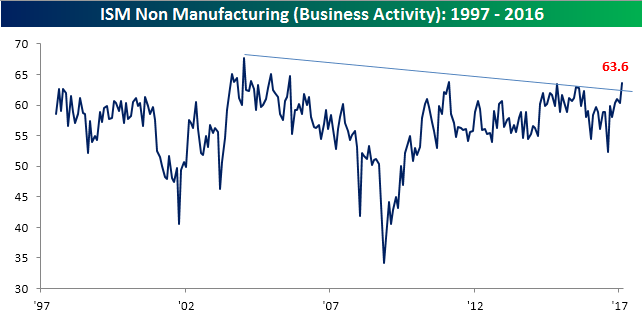
Of all the categories included in the ISM Non Manufacturing report, Business Activity was one of the most notable. As shown in the chart below, that component rose to its highest level since February 2011, breaking the trend of lower highs that has been in place since 2004.
To see Bespoke’s full line of macro and micro research, sign up for one of our premium membership options today! You won’t be disappointed.
Yields Rising (To Varying Degrees)
Learn more about Bespoke’s research and wealth management services.
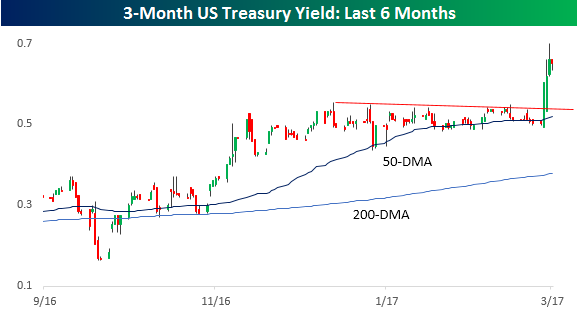
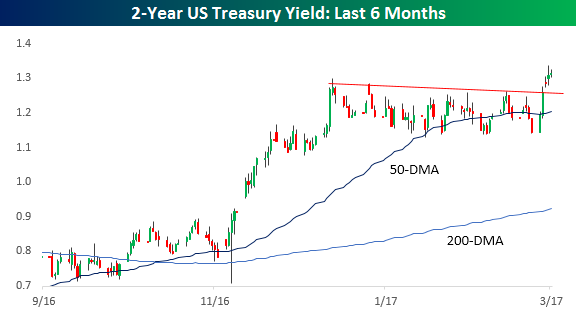
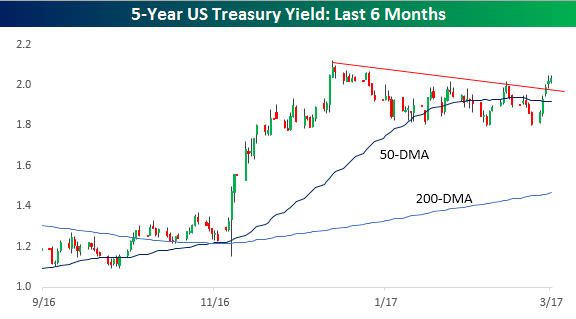
Treasury yields have been on the rise this week across the entire spectrum of the yield curve, but looking at the charts of different maturities shows a very different picture the further out on the curve you go. Let’s start with the shorter end of the curve. At both the three-month and two-year maturities, yields clearly broke out as expectations for a March hike become further etched into stone.
Further out on the curve at the five-year maturity, the downtrend in yields off the highs from mid-December has been broken and yields have made a slightly higher high, but the breakout looks a lot less convincing.
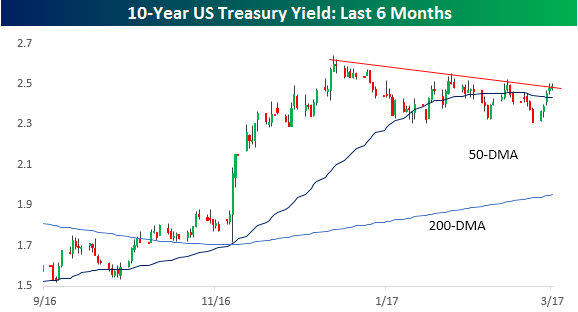
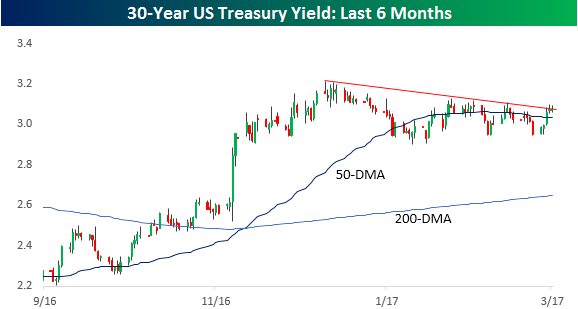
Looking out to ten and thirty years, you may be thinking what breakout in yields? Not only have yields at these maturities yet to convincingly break above their downtrends from the December highs, but they still haven’t even attempted a higher high in yields.
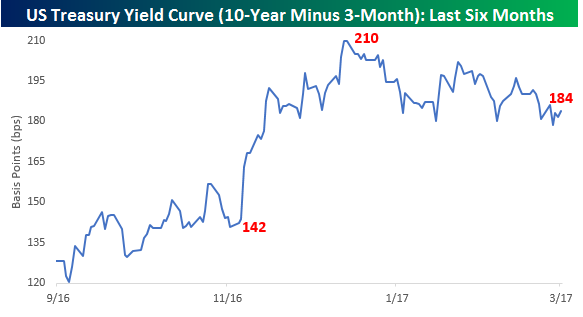
With the short end of the curve seeing much more of a move than the long end, the yield curve shows little signs of wanting to steepen. As of Friday morning, the spread between the yield on the ten-year and three-month US treasuries was at 184 basis points (bps), which is down 26 bps from the post-election high of 210 bps in December. That’s quite a bit of flattening in an environment when the economy is supposed to be picking up speed, although it is still much steeper than the 142 bps level it was at prior to the election.
To see Bespoke’s full line of macro and micro research, sign up for one of our premium membership options today! You won’t be disappointed.
The Closer — Snap Surges, Mexican PMI Crashes, Commodities Crumble — 3/2/17
Log-in here if you’re a member with access to the Closer.
Looking for deeper insight on global markets and economics? In tonight’s Closer sent to Bespoke Institutional clients, we look at the history of recent IPOs with lots of hype as well as large tech IPOs to provide some context around SNAP’s surge today. We also discuss Mexican PMI data from yesterday and the breakdown in a number of key commodities today.
The Closer is one of our most popular reports, and you can see it and everything else Bespoke publishes by starting a no-obligation 14-day free trial to our research!