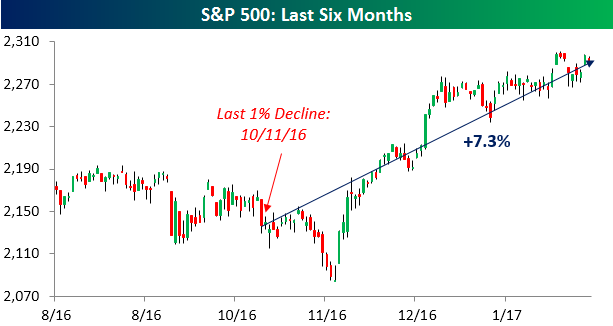
 While equities finished the day down on Monday and have now traded down on a daily basis more in the last three weeks than they have traded up, amazingly, we have yet to see a day since the November election where the S&P 500 dropped 1% or more. In fact, you have to go back nearly a month before the election to find the last time the S&P 500 dropped 1% in a single day. The lack of a 1% decline through Monday is notable for the fact that it has now been 80 trading days since the S&P 500 last saw a one-day decline of 1%+. During that span, the index is up 7.3%.
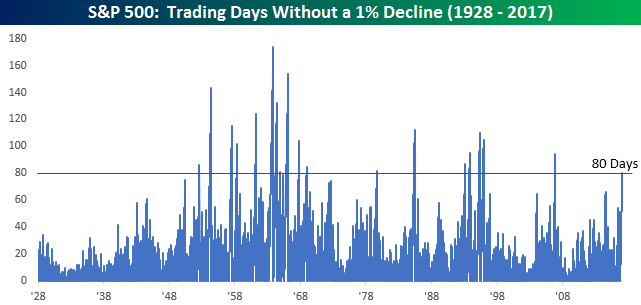
The chart below shows historical streaks of trading days since 1928 that the S&P 500 went without a decline of 1%+. Looking at the chart, these types of streaks were pretty common in the 1950s and 1960s, but from 1970 through the present, their frequency has become increasingly sporadic. While there were eleven streaks in the twenty-year stretch spanning the 1950s and 1960s, in the more than four decades since there have only been eight. In fact, the current streak represents the first 80+ trading day streak without a 1% decline since 2006, and before that, you have to go back to 1995 to find the next one.
Earlier today, we sent Bespoke Premium and Bespoke Institutional members a report highlighting the S&P 500’s performance during, and more importantly after, each of the prior 18 streaks. To see this report, sign up for a monthly Bespoke Premium membership.
