February Employment Report Preview
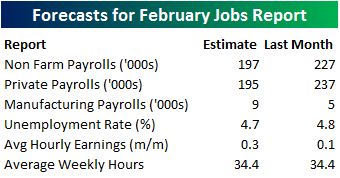 Heading into Friday’s Non-Farm Payrolls (NFP) report for February, economists are expecting an increase in payrolls of 197K, which would be a 30K decline from last month’s stronger than expected reading of 227K. In the private sector, economists are expecting an increase of 195K, which would be an even larger decline of 42K from January. The unemployment rate is forecasted to fall to 4.7%. Growth in average hourly earnings is expected to rebound back up to 0.3% after last month’s disappointing print of 0.1%, while hours worked is forecast to remain unchanged at 34.4.
With such high stakes surrounding the report, the market will likely have a big reaction to the upside or downside based on how the number comes in relative to expectations. To that end, we just published our eleven-page monthly preview for the February jobs report. This report contains a ton of analysis related to how the equity market has historically reacted to the monthly jobs report, as well as how secondary employment-related indicators we track looked in September. We also include a breakdown of how the initial reading for September typically comes in relative to expectations and how that ranks versus other months.
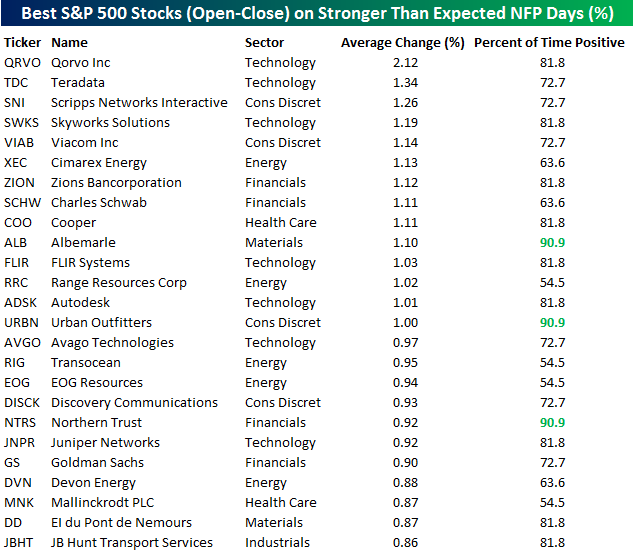
One topic we cover in each month’s report is the S&P 500 stocks that do best and worst from the open to close on the day of the employment report based on whether or not the report comes in stronger or weaker than expected. In other words, which stocks should you buy, and which should you avoid? The table below highlights the 25 best-performing stocks in the S&P 500 from the open to close on days when the Non-Farm Payrolls report has been better than expected over the last two years. Leading the way higher, shares of Qorvo (QRVO) have seen an average gain of 2.12% with positive returns between the bells 81.8% of the time. Behind QRVO, 13 other stocks have seen average gains of more than 1%, including relatively well-known names like Skyworks (SWKS), Viacom (VIAB), Charles Schwab (SCHW), and Urban Outfitters (URBN). Another name that has done well and seen consistent upside on better than expected Non Farm Payrolls days is Albemarle (ALB), which has been up from the open to close 91% of the time. ALB is a chemical company that has shown up on the radar of many traders as a lithium play on increased use of batteries in electric vehicles and other applications.
For anyone with more than a passing interest in how equities are impacted by economic data, this report is a must read. To see the report, sign up for a monthly Bespoke Premium membership now!
Bespoke CNBC Appearance (3/8/17)
Bespoke Co-Founder Paul Hickey appeared on CNBC’s Power Lunch on Wednesday to talk about the market’s and hedge fund manager David Tepper’s comments regarding US and global stocks. To view the segment, please click on the image below.
To see Bespoke’s full line of macro and micro research, sign up for one of our premium membership options today! You won’t be disappointed.

Fixed Income Weekly – 3/8/17
Searching for ways to better understand the fixed income space or looking for actionable ideals in this asset class? Bespoke’s Fixed Income Weekly provides an update on rates and credit every Wednesday. We start off with a fresh piece of analysis driven by what’s in the headlines or driving the market in a given week. We then provide charts of how US Treasury futures and rates are trading, before moving on to a summary of recent fixed income ETF performance, short-term interest rates including money market funds, and a trade idea. We summarize changes and recent developments for a variety of yield curves (UST, bund, Eurodollar, US breakeven inflation and Bespoke’s Global Yield Curve) before finishing with a review of recent UST yield curve changes, spread changes for major credit products and international bonds, and 1 year return profiles for a cross section of the fixed income world.
In this week’s note, we take a look at what’s driven the spread widening in high yield over the last couple of days.
Our Fixed Income Weekly helps investors stay on top of fixed income markets and gain new perspective on the developments in interest rates. You can sign up for a Bespoke research trial below to see this week’s report and everything else Bespoke publishes free for the next two weeks!
Click here to start your no-obligation free Bespoke research trial now!
Chart of the Day: 10 Year Treasury Yields Rise For An 8th Day
ETF Trends: Hedge – 3/8/17
Natural gas, Mexico, and the Philippines were the best performers over the past week with European equities also outperforming. We note that for the first time in a long time, one of the best performers over the past five trading days has been negative. We also note that there’s a large number of big decliners on our worst performers list.

Bespoke provides Bespoke Premium and Bespoke Institutional members with a daily ETF Trends report that highlights proprietary trend and timing scores for more than 200 widely followed ETFs across all asset classes. If you’re an ETF investor, this daily report is perfect. Sign up below to access today’s ETF Trends report.
See Bespoke’s full daily ETF Trends report by starting a no-obligation free trial to our premium research. Click here to sign up with just your name and email address.
Blowout ADP
Learn more about Bespoke’s research and wealth management services.
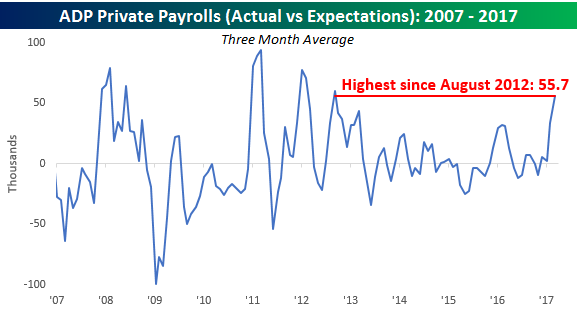
For the second month in a row, the monthly private payrolls report from ADP exceeded estimates, coming in above 250K. February’s print came in just shy of 300K at 298.4K, and it was well above the consensus print of 188K. This was the highest monthly print since April 2014, the third highest print of the expansion, and the second best two-month reading (559.5k) in the history of the survey (going back to 2007). No matter how you slice it, this indicator was strong.
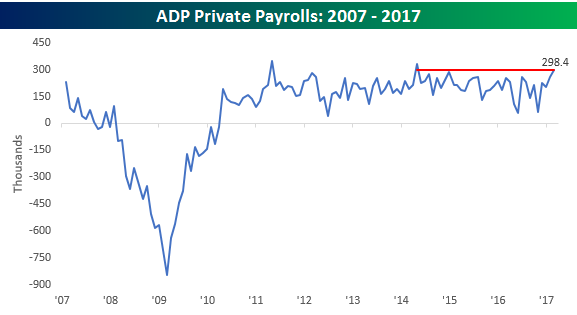
As mentioned above, this month’s ADP report was the second straight better than expected print, and over the last three months, the actual reported number has exceeded expectations by an average of 55.7K. As shown in the chart below, the three month average spread between the actual and estimated reading hasn’t been this positive since August 2012.
To see Bespoke’s full line of macro and micro research, sign up for one of our premium membership options today! You won’t be disappointed.
The Closer — Growth Groan, 3 Ranges & A Trend — 3/7/17
Log-in here if you’re a member with access to the Closer.
Looking for deeper insight on global markets and economics? In tonight’s Closer sent to Bespoke Institutional clients, we take a look at the disappointing growth trajectory for Q1. Bad seasonality was also evident in today’s consumer credit report. We also take a look at some technicals (and options trades) for S&P 500 sector ETFs and performance of SNAP versus recent IPOs and past tech IPOs.
The Closer is one of our most popular reports, and you can see it and everything else Bespoke publishes by starting a no-obligation 14-day free trial to our research!
B.I.G. Tips – Weakening Breadth in Small Caps: Pause or Something Else?
Chart of the Day: Two Uptrending Bespoke 50 Stocks
Least Overbought Market in a Month
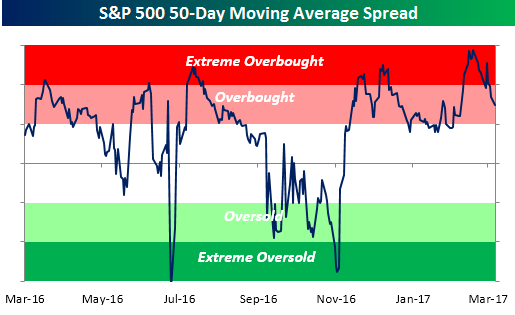
The chart below is from today’s Morning Lineup, and shows where the S&P 500 is trading relative to its trading range. When the blue line is in the red zones, it indicates that the S&P 500 is trading at short-term overbought levels (pink=between one and two standard deviations above the 50-day moving average (DMA), while dark red = S&P 500 is more than two standard deviations above its 50-DMA). Conversely, when the line is in the green zones, the market is short-term oversold (light green=between one and two standard deviations below the 50-DMA, while dark green = S&P 500 is more than two standard deviations below its 50-DMA). After reaching levels well into ‘extreme’ overbought territory in the last few weeks, the S&P 500 has been working its way down to less overbought levels as the market trades sideways and its moving averages and trading ranges play catch up. As of mid-day today, the S&P 500 is still trading at short-term overbought levels, but the degree to which it is overbought is the lowest in a month. While this doesn’t suggest that the market is trading at attractive levels from a timing perspective, it illustrates a fact that we have cited numerous times in the past and that is that just because a market is overbought doesn’t necessarily mean that it has to sell-off in order to work off the overbought condition. Corrections can occur in both price and time.
The Morning Lineup is not only one of our most popular daily reports, but it is also one of the most popular reports on Wall Street. Investors read it religiously each day in order to fully prepare themselves for the market open. There’s simply no better way to start the trading day! To receive access to the Morning Lineup each trading day, sign up for a Bespoke Premium membership now.