The Closer 3/10/17 – End of Week Charts
Looking for deeper insight on global markets and economics? In tonight’s Closer sent to Bespoke clients, we recap weekly price action in major asset classes, update economic surprise index data for major economies, chart the weekly Commitment of Traders report from the CFTC, and provide our normal nightly update on ETF performance, volume and price movers, and the Bespoke Market Timing Model.

The Closer is one of our most popular reports, and you can sign up for a free trial below to see it!
Click here to start your no-obligation two-week free Bespoke research trial now!
The Bespoke Report – Gr-Eight Expectations
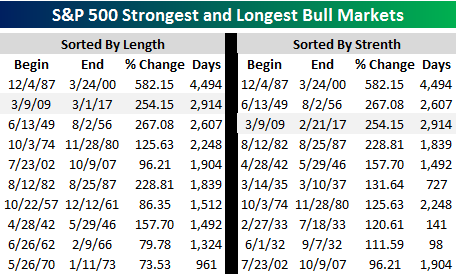 Eight years ago this week, the greatest buying opportunity in the lifetime of just about everybody reading this note came and went with little fanfare (as is usually the case at bottoms and tops). Even if you missed the exact low, though, there have been plenty of opportunities along the way to hop on, as the second longest and third strongest bull market of all time charged ahead. In terms of strength, if the S&P 500 rallies 4% from its 3/1 high, the current bull will also move into second place in terms of strength as well. Is there still any path left to ride for this bull?
Of the current members in the S&P 500, 39 have posted quadruple-digit returns since 3/9/09 (that’s over 1,000%!), including three that are up over 6,000%! On the other end of the spectrum, just 16 current members of the S&P 500 are down in the last eight years. In order to save anyone the potential frustration of either not owning the biggest winners or maybe owning some of the losers, we will refrain from listing either list here to help ensure that we don’t ruin your weekend.
If you’d like to read our thoughts on recent performance plus the rest of this week’s Bespoke Report newsletter, take advantage of our one-month Bespoke Premium free trial offer. Sign up now at this page.
Have a great weekend!
ETF Trends: International – 3/10/17
Oil continues to get hit hard as front-month WTI traded down another 1.8% today as of this writing. Other commodities plays (steel producers, metals & mining, silver, and Russia) all continue to suffer significantly. Developed market equities have been more respectable with European stocks especially rallying on economic optimism. Natural gas has also rebounded somewhat in recent days after a brutal winter period.

Bespoke provides Bespoke Premium and Bespoke Institutional members with a daily ETF Trends report that highlights proprietary trend and timing scores for more than 200 widely followed ETFs across all asset classes. If you’re an ETF investor, this daily report is perfect. Sign up below to access today’s ETF Trends report.
See Bespoke’s full daily ETF Trends report by starting a no-obligation free trial to our premium research. Click here to sign up with just your name and email address.
Apple (AAPL) Back on Top of the Dow
Learn more about Bespoke’s research and wealth management services.
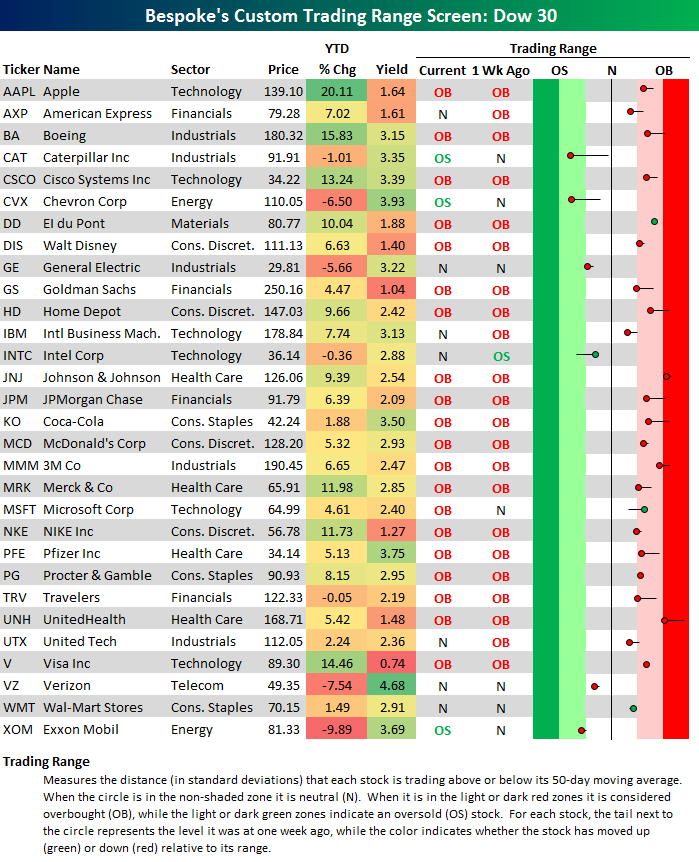
Below is an updated look at our Dow 30 trading range screen. For each Dow member, the dot represents where it’s currently trading, while the tail end represents where it was trading one week ago. The black vertical “N” line represents each stock’s 50-day moving average, and moves into the red or green zones are considered “overbought” or “oversold.”
As shown, a majority of Dow stocks remain in overbought territory, but most of them have also gotten less overbought over the last week. You can see this because the dot is to the left of the tail for many stocks. Johnson & Johnson (JNJ) is the only stock that remains in extreme overbought territory, which means it’s trading more than two standard deviations above its 50-day moving average. American Express (AXP), IBM, and United Tech (UTX) are three stocks that have moved from overbought down to neutral territory over the last week.
A few Dow stocks are struggling below their 50-day moving averages. Caterpillar (CAT) and Chevron (CVX) stand out the most after experiencing big moves lower from neutral into oversold territory over the last week.
In terms of year-to-date performance, Apple (AAPL) is back on top again with a 2017 gain of 20% already. Boeing (BA) and Visa (V) are two additional big winners. On the downside, Exxon Mobil (XOM) is leading the way lower with a YTD decline of 9.9%. Verizon (VZ) is down the second most of any Dow stock at -7.54%, followed by Chevron (CVX) and General Electric (GE).
To see Bespoke’s full line of macro and micro research, sign up for one of our premium membership options today! You won’t be disappointed.
Under Armour (UAA) Tops List of Most Heavily Shorted Stocks
Learn more about Bespoke’s research and wealth management services.
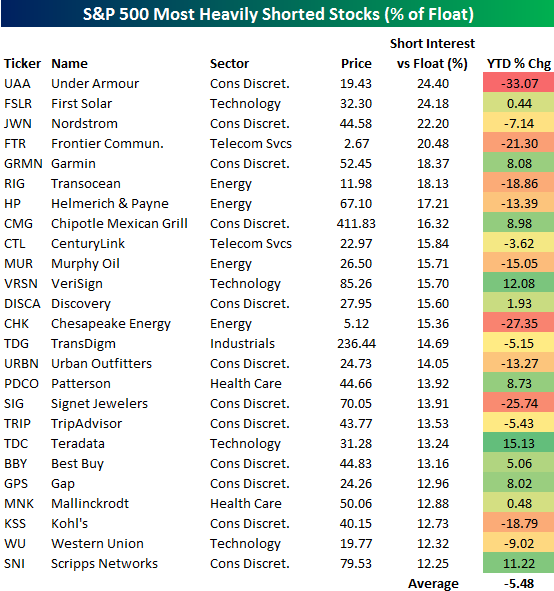
Earlier today we published our bi-weekly Short Interest Report for subscribers. One of the tables in the report highlights the most heavily shorted stocks in the S&P 500, which we’ve reproduced below.
As shown, Under Armour (UAA) is currently the most shorted stock in the S&P with 24.4% of its equity float sold short. First Solar (FSLR) ranks just behind Under Armour with 24.18% of its float sold short. Retailer Nordstrom (JWN) is the third most heavily shorted stock in the S&P 500, while Frontier Communications (FTR) and Garmin (GRMN) round out the top five. There are a significant amount of investors that have placed negative bets on these five large-cap companies.
Other notables on the list of most shorted stocks in the S&P 500 include Chipotle (CMG), Urban Outfitters (URBN), TripAdvisor (TRIP), Best Buy (BBY), Gap (GPS), and Kohl’s (KSS).
On average, the stocks listed in the table are down 5.5% year-to-date. That’s much weaker than the 5%+ gain that the S&P 500 has seen, and it shows that at least some short sellers are having a good year even in a rising market.
To see Bespoke’s full line of macro and micro research, sign up for one of our premium membership options today! You won’t be disappointed.
Bespoke’s Quick-View Chart Book — 3/10/17
Short Interest Report: 3/10/17
8-Year 10-Baggers
Learn more about Bespoke’s research and wealth management services.
Yesterday was the 8th anniversary of the Financial Crisis lows for the S&P 500. It doesn’t qualify as the 8th anniversary of the current bull market, however, since the index didn’t close at a new bull market high yesterday. We won’t know if the bull market officially turned 8 until a new high is made past the 3/9/17 date. (If the S&P ends up declining 20% from the bull market highs reached last week, the bull market will have never made it to its 8th birthday.)
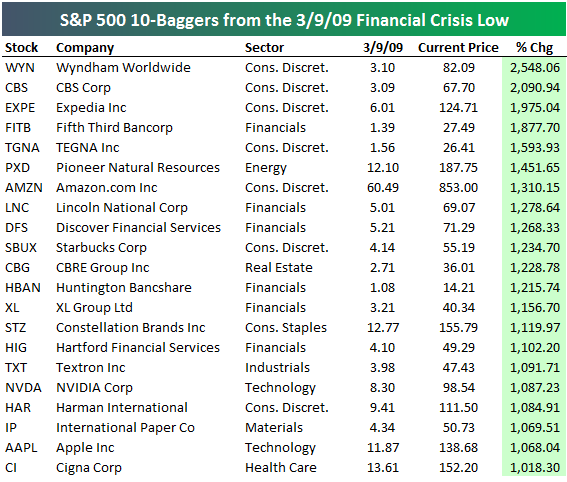
We went back and took a snapshot of the S&P 500’s index members on March 9th, 2009, and calculated the percentage change since that date of each index member that’s still in existence. Below is a list of the S&P 500 stocks as of 3/9/09 that are up 10x or more since then — the elusive “tenbaggers” that famed investor Peter Lynch loved so much.
As shown, Wyndham Worldwide (WYN) is up the most of any stock that was in the S&P 500 on 3/9/09 with a gain of 2,548%. CBS Corp. (CBS) ranks second with a gain of 2,091%, followed by Expedia (EXPE), Fifth Third Bancorp (FITB), TGNA (formerly Gannett), and Pioneer Natural Resources (PXD).
Amazon.com (AMZN) ranks seventh with a gain of 1,310%, Starbucks (SBUX) ranks tenth with a gain of 1,235%, and Apple (AAPL) ranks twentieth with a gain of 1,068%.
If you have a hard time remembering just how dour the outlook was back in early March 2009, you can read what the headlines were saying in this report that we publish for clients every month. At the time, there was hardly a bull to be found, but 3/9/09 turned out to be the greatest buying opportunity of a generation. Remember that headlines are by definition a lagging indicator — they don’t tell us what the future holds.
To see Bespoke’s full line of macro and micro research, sign up for one of our premium membership options today! You won’t be disappointed.
The Closer — Comfort Soars, Fixed Income Frustration, Funds A’ Flowin’ — 3/9/17
Log-in here if you’re a member with access to the Closer.
Looking for deeper insight on global markets and economics? In tonight’s Closer sent to Bespoke Institutional clients, we discuss a very strong print from the weekly Bloomberg Consumer Comfort index. We also discuss today’s ECB decision, the quarterly Flow of Funds report released by the Fed today, and the carnage in fixed income over the last couple of days.
The Closer is one of our most popular reports, and you can see it and everything else Bespoke publishes by starting a no-obligation 14-day free trial to our research!
Bespoke’s Sector Snapshot — 3/9/17
We’ve just released our weekly Sector Snapshot report (see a sample here) for Bespoke Premium and Bespoke Institutional members. Please log-in here to view the report if you’re already a member. If you’re not yet a subscriber and would like to see the report, please start a 14-day trial to Bespoke Premium now.
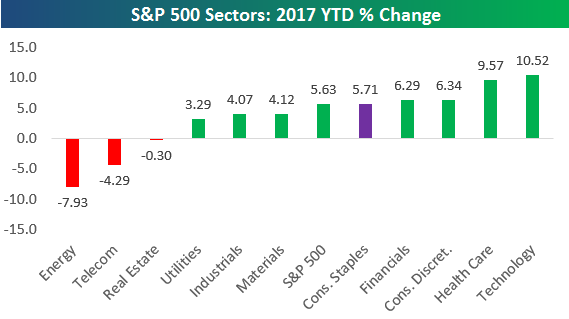
Below is one of the many charts included in this week’s Sector Snapshot, which highlights the year-to-date returns for the eleven major S&P 500 sectors. As you can see, Technology is leading the way with a gain of 10.52%, while Energy is lagging severely with a decline of 7.93%.
To see our full Sector Snapshot with additional commentary plus six pages of charts that include analysis of valuations, breadth, technicals, and relative strength, start a 14-day free trial to our Bespoke Premium package now. Here’s a breakdown of the products you’ll receive.