Fixed Income Weekly – 3/22/17
Searching for ways to better understand the fixed income space or looking for actionable ideals in this asset class? Bespoke’s Fixed Income Weekly provides an update on rates and credit every Wednesday. We start off with a fresh piece of analysis driven by what’s in the headlines or driving the market in a given week. We then provide charts of how US Treasury futures and rates are trading, before moving on to a summary of recent fixed income ETF performance, short-term interest rates including money market funds, and a trade idea. We summarize changes and recent developments for a variety of yield curves (UST, bund, Eurodollar, US breakeven inflation and Bespoke’s Global Yield Curve) before finishing with a review of recent UST yield curve changes, spread changes for major credit products and international bonds, and 1 year return profiles for a cross section of the fixed income world.
In this week’s note, we examine how far rates could fall if the current risk-off tone of equity and credit markets continues.

Our Fixed Income Weekly helps investors stay on top of fixed income markets and gain new perspective on the developments in interest rates. You can sign up for a Bespoke research trial below to see this week’s report and everything else Bespoke publishes free for the next two weeks!
Click here to start your no-obligation free Bespoke research trial now!
ETF Trends: Hedge – 3/22/17
Gold, EM equities, and natural gas had the biggest gains over the past week while the flattening yield curve savaged banks. Biotechs, metals and mining, solar stocks, and retail all sold off, with the 20 worst performing ETFs we track all recording declines of at least 3.3% over the past week.

Bespoke provides Bespoke Premium and Bespoke Institutional members with a daily ETF Trends report that highlights proprietary trend and timing scores for more than 200 widely followed ETFs across all asset classes. If you’re an ETF investor, this daily report is perfect. Sign up below to access today’s ETF Trends report.
See Bespoke’s full daily ETF Trends report by starting a no-obligation free trial to our premium research. Click here to sign up with just your name and email address.
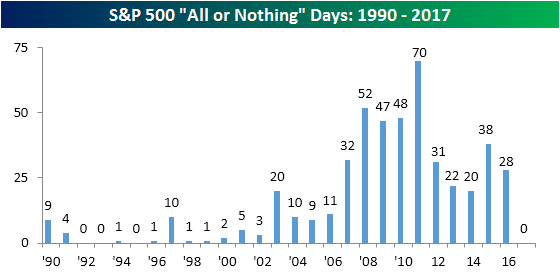
All or Nothing Days: A Dying Breed
For those unfamiliar with the term, we consider an “all or nothing day” to be one where the S&P 500’s net daily A/D (advance/decline) reading is greater than +/-400. Throughout the financial crisis and most of the current bull market, the frequency of all or nothing days increased substantially relative to the years before. The reason for the increase was a one-two punch of an easy Fed and ETFs. As far as the Fed is concerned, easy money and low interest rates increased the attractiveness of equities relative to other asset classes, while at the same time ETFs provided an easy vehicle for investors to gain exposure to stocks while minimizing company specific risk. The result was an environment of a rising tide lifting all boats and vice versa, and the chart below says it all. From 1990 through 2005, there were just two years where the S&P 500 saw a double-digit number of all or nothing days, but from 2006 on, their frequency exploded and there hasn’t been a single year where there were less than ten all or nothing days. In fact, outside of 2006, there hasn’t been a single year where there were less than 20 all or nothing days!
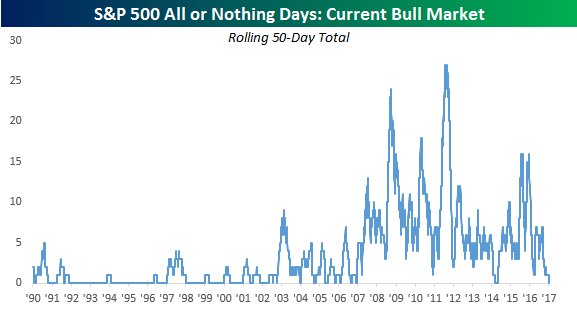
This year, however, has been a different story. With the year already almost a quarter over, there has yet to be a single all or nothing day for the S&P 500. While the lack of volatility is definitely one factor at play, even in Tuesday’s decline, the net A/D reading for the S&P 500 was just -370. So even on a 1% down day, the market couldn’t muster an all or nothing day. The chart below shows the frequency of all or nothing days in a different context as above by showing the rolling 50-day total. As shown in the chart, there hasn’t been a single all or nothing day for the S&P 500 since 12/28/16 and that has brought the rolling 50-day total down to zero for the first time since the spring/summer of 2014 and just the second time since the start of the Financial Crisis. So what’s the root cause for the decline in all or nothing days? ETFs certainly haven’t become less popular, so that leaves the Fed. With the Fed having hiked rates twice in the last three months, the days of the Fed lifting all boats are in the rear-view mirror, and future gains are going to have to be on the back of companies/sectors showing earnings growth and/or the beneficiaries of regulatory/tax relief.
The Closer — Assessing The Selling, Counting The Current Account — 3/21/17
Log-in here if you’re a member with access to the Closer.
Looking for deeper insight on global markets and economics? In tonight’s Closer sent to Bespoke Institutional clients, we take a look at the lay of the land after the selloff in US equities today. We also chart up the quarterly BEA data on the current account deficit.
The Closer is one of our most popular reports, and you can sign up for a free trial below to see it!
The Closer is one of our most popular reports, and you can see it and everything else Bespoke publishes by starting a no-obligation 14-day free trial to our research!
B.I.G. Tips – Streak of Trading Days Without 1%+ Decline Ends at 109
B.I.G. Tips – Bearishly Bullish
A Tectonic Shift in Global Returns?
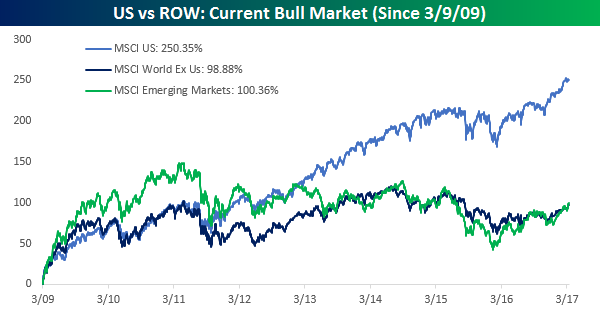
From the Financial Crisis lows in March 2009, the global rally in equities has been primarily US-centric. While the MSCI US equity index is up over 250%, the MSCI Developed World Ex US (98.88%) and the MSCI Emerging Market (100.36%) indices are both up considerably less during this period in terms of US dollar adjusted returns, or the returns a US investor would have seen. While the three indices performed relatively in line with each other in the first two or so years of the bull market, the US really started to break away from the pack beginning in 2013.
The last several months, however, have been another story. The chart below is the same as above but shows dollar-adjusted returns only so far in 2017. Rather than leading the pack in 2017, the US is lagging. As shown, while the MSCI US index is up 6.2% on the year, the Developed World Ex-US index is outperforming the US slightly with a gain of 6.3%. The real showstopper has been the MSCI Emerging Markets Index which is up more than twice as much as the US and Developed World indices!
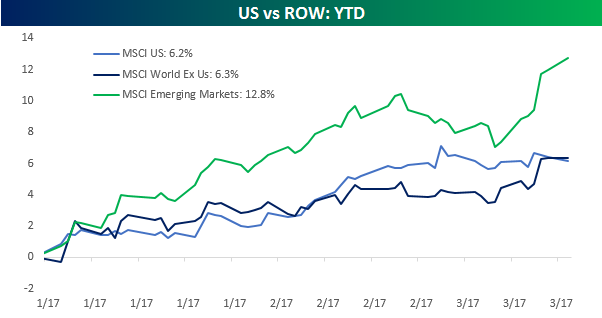
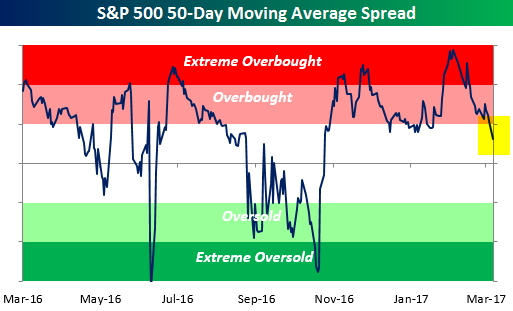
Chart of the Day: Overbought Streak Poised to End
With the S&P 500 giving up earlier gains and trading lower on the day, the index is poised to close at non-overbought levels (>1 standard deviation above its 50-DMA) for the first time since 2/2. For reference, any close below 2,371.42 would move the index into neutral from overbought territory.
At a streak of 31 trading days overbought, this is the seventh longest streak of overbought closes in the current bull market and the eighth streak of 30 or more trading days. In today’s Chart of the Day (available to all paid clients), we took a closer look at prior streaks during the current bull market where the S&P 500 ended streaks of 30 or more trading days above its 50-DMA to see what patterns played out regarding its performance going forward. Sign up for a free-trial below to check it out!
ETF Trends: US Indices & Styles – 3/21/17
Gold miners were the best performers over the last week among ETFs we track. EM country ETFs and broad EM ETFs were the next best performers, owning the top of the recent performance slate. On the other side, banks undeperformed sharply over the past week with the USD, Health Care, and Senior Loans also performing well.
Bespoke provides Bespoke Premium and Bespoke Institutional members with a daily ETF Trends report that highlights proprietary trend and timing scores for more than 200 widely followed ETFs across all asset classes. If you’re an ETF investor, this daily report is perfect. Sign up below to access today’s ETF Trends report.
See Bespoke’s full daily ETF Trends report by starting a no-obligation free trial to our premium research. Click here to sign up with just your name and email address.