Consumer Confidence – It’s All About the Income
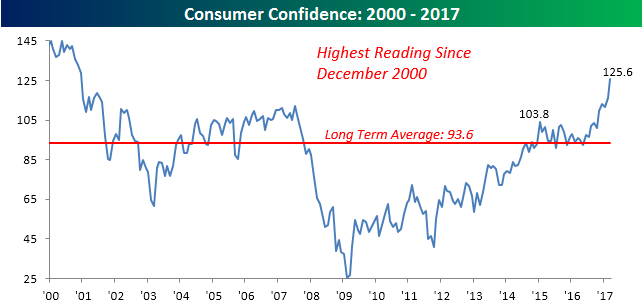
Today’s Consumer Confidence report for the month of March was impressive on a lot of fronts. Besides the fact that it was the fifth biggest beat relative to expectations for the headline index since 1999 and both Present Situation and Expectations saw healthy increases, confidence levels are also now comfortably above the highs we saw during the prior expansion from 2003 through 2007. That breaks what had been a trend of lower highs in confidence that formed from the peak Consumer Confidence readings in the 1990s.
If there was one concerning aspect of the report, though, it was the factors that drove confidence levels higher. The chart below compares Consumer Confidence based on consumers with income levels of more than $50K and between $35K and $50K. As shown, while higher income Americans saw their confidence levels surge to the highest levels since late 2000, confidence among consumers with more modest incomes actually declined and has yet to exceed the peak levels we saw from the last cycle.
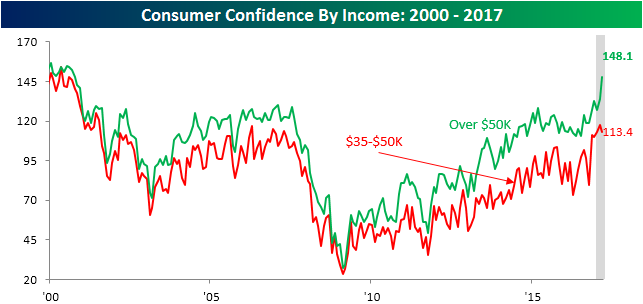
Chart of the Day – Consumer Confidence Blowout
To say that this morning’s Consumer Confidence report was better than expected would be a major understatement. With economists expecting the headline index to fall slightly to 114.0, the actual reading blew the roof off of estimates coming in at 125.6, which was the best reading since December 2000. In terms of how the report came in relative to expectations, today’s report was the fifth biggest beat since at least 1999 and just the seventh time that the actual reading has exceeded expectations by ten or more points.
In today’s Chart of the Day (available to all paid clients), we took a closer look at days where Consumer Confidence exceeded expectations by a large margin to see how the market traded on an intraday basis. Sign up for a free-trial below to check it out!

DJIA Nine-Day Losing Streaks
Yesterday may have been a moral victory for the bulls as the DJIA rebounded well off of its early lows, but at the end of the day, it still finished down for the eighth straight day. It was also the first day of the losing streak where the DJIA never traded in positive territory on an intraday basis. It’s still early today, but the DJIA is currently on pace to open modestly in the red once again, and if those declines hold until the end of the trading day, it will be the first time the DJIA has been down for nine straight trading days in over 39 years. A large percentage of people working on Wall Street today weren’t even alive the last time the DJIA had a nine-day losing streak.
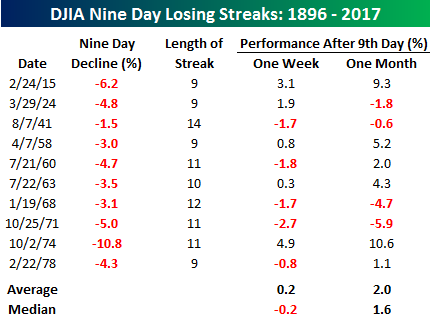
The table below lists the ten prior nine-day losing streaks that the DJIA has seen in its history going back to 1896. For each streak, we list the magnitude of the decline in the first nine days, how many trading days the losing streak lasted overall, as well as how the DJIA performed over the following week and month. The longest losing streak the DJIA has ever had was fourteen trading days, which was back in 1941. Like the current period, the DJIA’s decline during the initial nine days back then was very muted (1.51% compared to about 1.9% now). Interestingly enough, of the ten prior streaks where the DJIA was down for nine straight days, more often than not (six times) it went down for a tenth day as well, and half of the time (five times) it went on to decline for at least an eleventh day. Looking at returns going forward, the DJIA’s average one week change following the ninth straight day of losses has been a gain of 0.2% (median: -0.2%), while the average one month return has been a gain of 2.0% (median: +1.6%). If you are looking for the market to snap back quickly from here after nine straight days of declines, it is generally not the norm.
The Closer — Ready Patch to the Rescue — 3/27/17
Log-in here if you’re a member with access to the Closer.
Looking for deeper insight on global markets and economics? In tonight’s Closer sent to Bespoke Institutional clients, we review today’s rebound, look at how trends over the last six months compare to other periods in the past, and look at how earnings warnings so far this quarter compare to other quarters.
The Closer is one of our most popular reports, and you can sign up for a free trial below to see it!
The Closer is one of our most popular reports, and you can see it and everything else Bespoke publishes by starting a no-obligation 14-day free trial to our research!
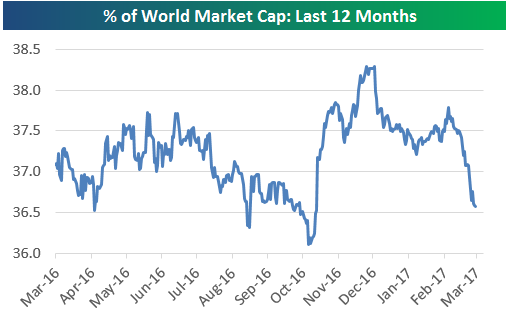
US Quickly Losing Share of World Market Cap
Below is a one-year chart showing the percentage of total world equity market capitalization that the US stock market makes up (from Bloomberg‘s world market cap indices). Heading into the 2016 Presidential Election, the US was losing market share to the rest of the world. But following President Trump’s victory, this reading shot up from just over 36% to nearly 38.5%. That’s a huge move.
Since peaking at the end of 2016, however, we’ve seen a steady drift lower down to just above 36.5%. At this point the US has only gained a very small % of share in world market cap since Trump’s victory night.
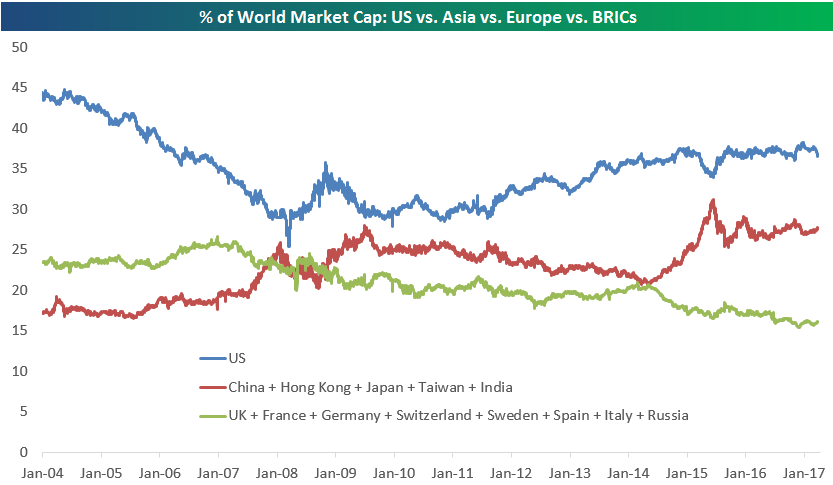
Below is chart that highlights shifts in world market cap since 2004 for the US, Europe, and Asia. As you can see, from 2004 through mid-2007, Europe had the second highest share of world market cap behind the US. But once the Financial Crisis hit, Asia eclipsed Europe, and at one point in mid-2009, Asia was just a couple percentage points away from the US. As the current bull market has progressed, the US has re-gained a sizable lead in first place, while Asia now sits solidly in second place. Europe, however, has been trending lower and lower…and lower.
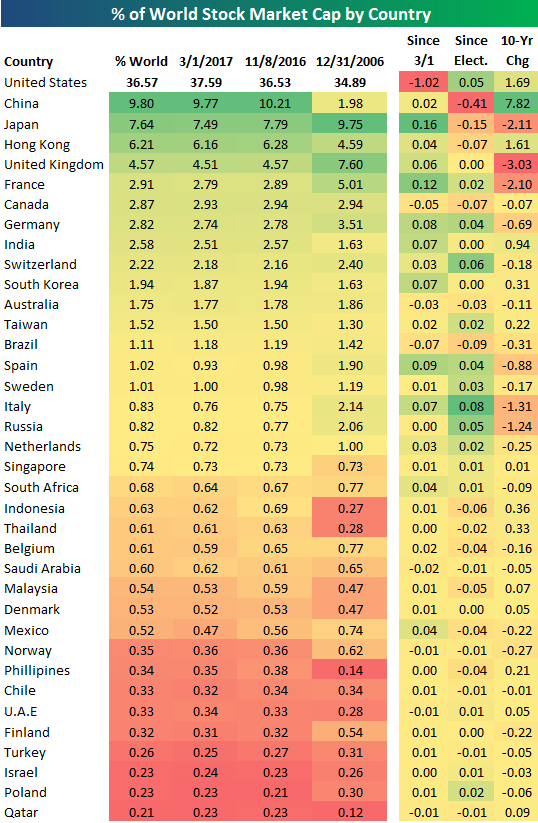
Below is a table showing % of world market cap for a large number of countries, sorted from largest (US) to smallest (Qatar). Countries that make up less than 0.2% of world market cap are not included. In this table, we just wanted to highlight changes seen in % of world market cap since the Presidential Election last November 8th as well as since March 1st when the US equity market peaked. As you can see, the US has lost a full percentage point in share since March 1st, and it’s up just 0.05 percentage points since the close on Election night. Notably, it’s European countries that have seen a small bounce in share since the Election, while Asian countries like China, Japan, and Hong Kong have dipped. Start a two-week free trial to sample Bespoke’s premium research.
US Dollar Index Five-Year Chart
Below is a look at a chart of the US Dollar index over the last five years. While the Dollar had a big rally in the second half of 2016, its recent pullback puts it at the same level it was trading at both in early and late 2015. The real run for the Dollar was in the second half of 2014 when it made a leg higher from a range between 80-85 up to a new range between 90-100.
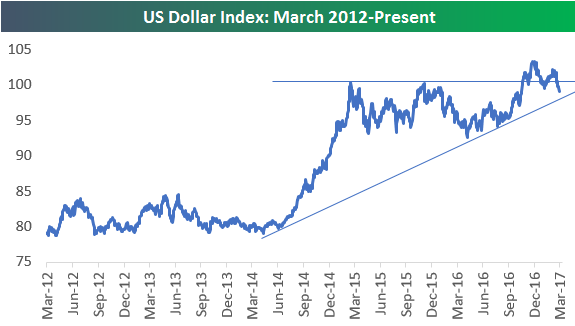
Chart of the Day: 50-DMA Break
If the S&P 500 closes below ~2,333 today, it will be the first time in 93 trading days that the index closed below its 50-day moving average. Given that price above or below the 50-DMA is seen as a line of demarcation for whether an index is in a short-term up- or down-trend, a close below the 50-DMA will have technicians switching to a more bearish tune.
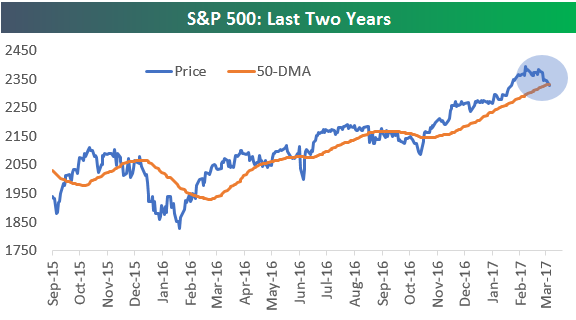
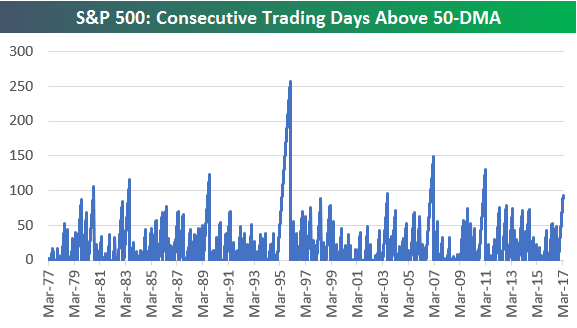
The current streak of 93 trading days above the 50-day is the longest since a 130-trading day stretch that ended in March 2011. Over the last 20 years, this is only the fifth time the index has had a streak of more than 4 months (roughly 88 trading days) above its 50-day, and it’s only the 11th streak of more than 4 months over the last 50 years.
So how has the market historically done when it has broken below its 50-day after trading above it for a long stretch of time like it has just done? We just sent today’s Chart of the Day to Bespoke research subscribers with an answer to this question. The results may surprise you. If you’re not yet a subscriber, you can see the report by starting a 14-day no-obligation free trial below. Please log-in here if you’re already a member.
Stock Seasonality Report – 3/27/17
DJIA Seven Day Losing Streaks
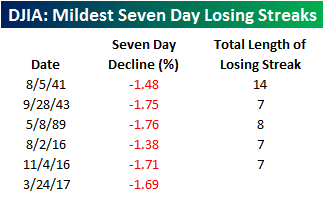
It’s been a lousy few days for the US equity market, and nowhere has that been more evident than in the Dow, which was down for seven straight days heading into Monday. While the Dow is down for seven straight days, you’d be excused for not realizing it given that the total decline during this period is less than 1.7%! In fact, of the 93 Dow losing streaks of seven or more trading days, the current one is only the sixth where the Dow is down less than 2%, and it ranks as the third mildest seven-day losing streak on record.
In the table below, we list each of the prior seven-day losing streaks for the Dow where the index declined less than 2%. Interestingly enough, half of all the streaks listed have occurred during the current bull market, while the remaining three occurred in 1989, 1943, and 1941. That one streak in 1941 ended up lasting for a record 14 straight trading days but only saw a total decline of 3.39%. Finally, with the Dow down 120 points in early trading on Monday, it is looking likely that the current streak will extend to at least an eighth day. If that happens, it will be the first eight-day losing streak since 2011 and only the third such streak since 1990.
Bespoke Brunch Reads: 3/26/17
Welcome to Bespoke Brunch Reads — a linkfest of the favorite things we read over the past week. The links are mostly market related, but there are some other interesting subjects covered as well. We hope you enjoy the food for thought as a supplement to the research we provide you during the week.
Economic Research
The Risk of Automation for Jobs in OECD Countries (OECD)
Please note to access this paper, you’ll have to click the PDF link in the abstract. The research from ZEW Mannheim in Germany argues that a relatively small proportion of total jobs in developed economies are at risk of automation substitution: only 9%. Hardly the rise of the machines that gets so much attention in the popular media! [Link]
Mortality and morbidity in the 21st century by Anne Case and Sir Angus Deaton (Brookings)
An expansion of the data in this married duo’s 2015 paper that identified large increases in mortality and morbidity for white Americans, a process which has continued in more recent updates to demographic data. [Link; 60 page PDF]
We hear about US jobs outsourced overseas (or stolen), but what about the ‘insourced’ jobs we ‘steal’ from abroad? by Mark J. Perry (AEI)
An excellent counter-factual on the impact of jobs flowing across borders. 6.4 million Americans (including over half a million each in Texas and California and more than 200,000 each in Illiniois, Michigan, Ohio, Florida, Georgia, North Carolina, Massachusetts, and New Jersey) work onshore for offshore companies, jobs which must be included as a benefit of trade and capital flow liberalization. [Link]
The Need for Very Low Interest Rates in an Era of Subdued Investment Spending by Thomas Klitgaard and Harry Wheeler (NY Fed)
An investigation of low investment spending, low interest rates, and their shared drivers. [Link]
Real Estate
Americans’ Shift To The Suburbs Sped Up Last Year by Jed Kolko (FiveThirtyEight)
Indeed.com’s chief economist takes a look at updated population growth data to argue that the much-hyped trend of strong urban growth is mostly a myth; it’s actually suburbs that have seen the fastest population growth recently. [Link]
Home Flipping in U.S. Hits 10-Year High by Kathryn Hopkins (Mansion Global)
New data from ATTOM Data Solutions suggests that 193,000 single family homes were flipped in 2016, the highest number since the peak over 275,000 in 2006. [Link]
Investors
Eton Park to Shut Down as $3 Trillion Hedge Fund Industry Faces Turmoil by Matthew Goldstein (NYT)
Eton Park once managed as much as $14 billion but poor performance, asset withdrawals, and market conditions have all driven the fund to liquidate. [Link; soft paywall]
Goldman building robo-adviser to give investment advice to the masses by Olivia Oran (Reuters)
With more and more assets fleeing to indexing and the sort of low-touch advice that best suits that investment approach, Goldman is seeking to build a competitive offering for the mass-affluent. [Link]
Cyber Security
That thing about pwning N26 by Oscar D. Torson (Medium)
A summary of the horrific security implementation of a bank in Europe called N26, which exposed customer accounts to mass hacking and bank fraud. [Link]
U.S. Preparing Cases Linking North Korea to Theft at N.Y. Fed by Aruna Viswanatha and Nicole Hong (WSJ)
Back in 2016, thieves used illicitly obtained SWIFT codes belonging to Bangladesh’s central bank to wire funds from their account at the NY Fed to bank accounts in the Philippines. [Link; paywall]
Personal Politics
Here’s Where Rockefeller Was Different by Eddy Elfenbein (Observer)
The death of Rockefeller recently gives friend-of-Brunch-Reads and investor Eddy Elfenbein a chance to inform us of the unique – and no-longer used – approach that he brought to his life of academics, business, and public service. [Link; auto-playing video]
The Republican-Democrat Divide Extends To Hats And Prepaid Cell Phones by Leticia Miranda (Buzzfeed)
Our politics extend far beyond our voting patterns and into the choices we make about consumer products. [Link]
Millennials
Millennials Don’t Consider Themselves Adults Until 30, Researcher Says by Tony Maglio (The Wrap)
Getting older keeps taking longer, apparently, with the current crop of young adults (whose median age is 30) taking longer to self-identify as adults than previous generations. [Link]
Tech
Instagram to Let Users Book With Businesses in Challenge to Yelp by Sarah Frier (Bloomberg)
New functionality is coming to Instagram that will allow businesses to offer consumers a chance to make a purchase or schedule a service in-app. [Link]
Food
Why Almond Growers Are Going Nuts by Heather Haddon and Lucy Craymer (WSJ)
Almonds are finicky nuts, apparently, as the torrential rains (a record) in California has interfered with the latest crop, which previously had to deal with too little rainfall. [Link; paywall]
Failure to Lunch by Malia Wollan (NYT Magazine)
A comprehensive review of the (possibly) lamentable habit of consuming the mid-day meal alone at one’s desk instead of outside the work place or in a communal area. [Link]
Lessons from the school of spaghetti carbonara by Kevin Pang (A.V. Club)
A history lesson and culinary class all at once, this masterpiece dives into the gooey, smooth, and rich pile of spaghetti and saturated fat that is beloved (but often improperly cooked) around the world. [Link]
Basketball
The NBA’s Secret Addiction by Baxter Holmes (ESPN)
We had no idea that the enormous bodies of that star on the hardwood are so frequently fueled by the best (we’re taking no arguments here) after-school snack of all time. [Link]
Inside the ‘Tinderization’ of today’s NBA by Tom Haberstroh (ESPN)
Tinder and Instagram are starting to take the place of late night bottle service as NBA players steer away from hard partying at clubs while on the road. [Link; auto-playing video]
Frank Martin: ‘I wrote to 120 coaches. Only one sent a handwritten note back’ by Chris Vannini (Coaching Search)
There are no moral victories for the Duke Blue Devils, but their loss to South Carolina in the round of 32 last weekend was the closing of a circle that dates back to a brutal job search for Gamecocks’ head coach Frank Martin. [Link]
Strange Science
Dutch scientist proposes circular runways for airport efficiency by Barbara Eldredge (Curbed)
We have no idea if the physics of this idea work but it’s certainly innovative. [Link]
A New Blast May Have Forged Cosmic Gold by Joshua Sokol (Quanta)
A cosmological investigation of where gold actually comes from; the answer isn’t as simple as it might seem. [Link]
Spoiled Science by Tom Bartlett (Chronicle of Higher Education)
A famed and widely-quoted Cornell food scientist is under fire for possible falsification of research data and poor practices that may have delivered inaccurate results. [Link]
Have a great Sunday!