ETF Trends: Fixed Income, Currencies, and Commodities – 4/5/17
South Africa and GAF (which has a large position in South Africa) have been the worst performers over the past week with Retail stocks also a leading decliner. A smattering of Asia, EM, and FX ETFs round out our list of the biggest decliners. On the winning end, oil is down sharply off today’s highs thanks to bearish EIA inventory numbers but is still up notably over the past week. MLPs, a few EM names, and MLPs are also up a decent amount.

Bespoke provides Bespoke Premium and Bespoke Institutional members with a daily ETF Trends report that highlights proprietary trend and timing scores for more than 200 widely followed ETFs across all asset classes. If you’re an ETF investor, this daily report is perfect. Sign up below to access today’s ETF Trends report.
See Bespoke’s full daily ETF Trends report by starting a no-obligation free trial to our premium research. Click here to sign up with just your name and email address.
Fixed Income Weekly – 4/5/17
Searching for ways to better understand the fixed income space or looking for actionable ideals in this asset class? Bespoke’s Fixed Income Weekly provides an update on rates and credit every Wednesday. We start off with a fresh piece of analysis driven by what’s in the headlines or driving the market in a given week. We then provide charts of how US Treasury futures and rates are trading, before moving on to a summary of recent fixed income ETF performance, short-term interest rates including money market funds, and a trade idea. We summarize changes and recent developments for a variety of yield curves (UST, bund, Eurodollar, US breakeven inflation and Bespoke’s Global Yield Curve) before finishing with a review of recent UST yield curve changes, spread changes for major credit products and international bonds, and 1 year return profiles for a cross section of the fixed income world.
In this week’s note, we analyze the aggregate difference between the price of fixed income closed-end funds and their underlying holdings.

Our Fixed Income Weekly helps investors stay on top of fixed income markets and gain new perspective on the developments in interest rates. You can sign up for a Bespoke research trial below to see this week’s report and everything else Bespoke publishes free for the next two weeks!
Click here to start your no-obligation free Bespoke research trial now!
ISM Services Declines to Lowest Level Since October
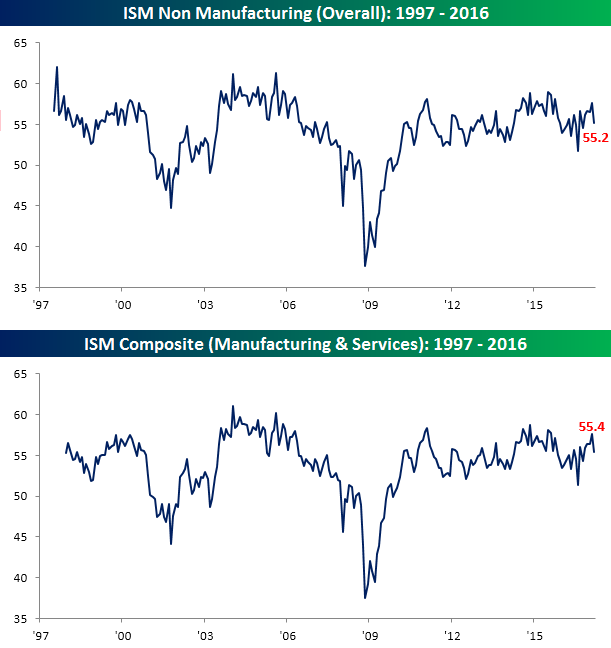
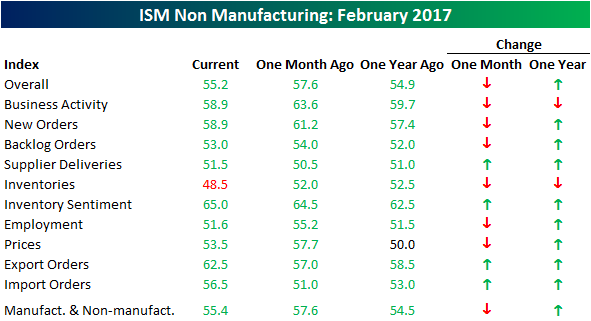
After a very strong ‘hard’ data report earlier in the day from ADP, today’s ‘soft’ data point came in weaker than expected in the form of the ISM Services report. While economists were forecasting the headline reading to come in at a level of 57.0 versus last month’s reading of 57.6, the actual reading came in at 55.2, which was the lowest reading since October. On a combined basis, the ISM report for March declined to 55.4 from 57.6, marking the first m/m decline since October.
In terms of the Services PMI internals, March was a weaker month relative to February. Of the report’s ten sub-components, six declined and four increased. The biggest increases this month were in Export and Import Orders, while the largest decline came from Business Activity, Prices, and Employment. On a y/y basis, breadth was much stronger with eight components increasing and just two (Inventories and Business Activity) declining.
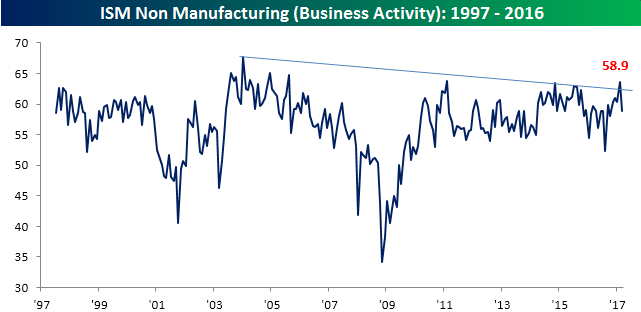
Some of the more interesting charts from this month’s reports came from the Business Activity, Employment, and Export Orders components. First, after looking as though it had broken its downtrend following last month’s strong showing, Business Activity fell back below that trendline this month. At a level of 58.9, though, it is still indicative of solid growth.
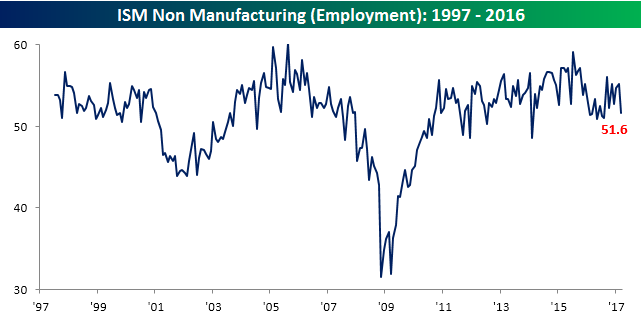
With the March employment report coming on Friday, the Employment component of the ISM Services report is always worth watching. This month, that component saw its largest drop since October and at 51.6 is showing only modest growth. It’s hard to reconcile this relatively weak level with the strong ADP report earlier in the day, but there can always be noise from month to month.
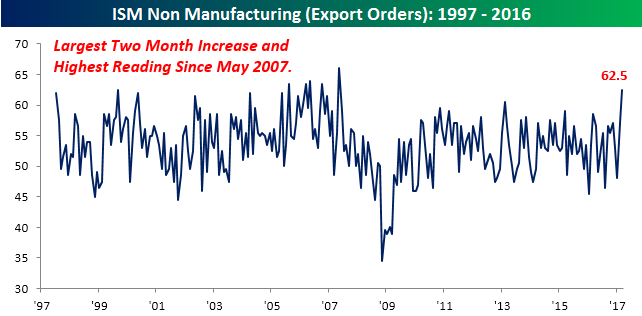
With respect to Export Orders, the weaker dollar is really benefiting multi-nationals. As shown in the chart below, this component now sits at its highest level since May 2007 after putting in its largest two-month increase since that same month.
ADP Private Payrolls Smash Expectations
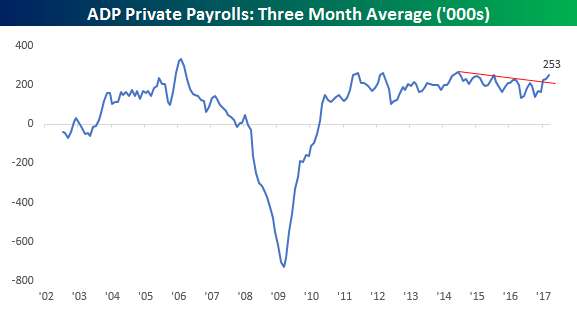
The latest print of ADP Private Payrolls for the month of March came in at 263.5K, marking the third straight month that the US economy has created more than 240K private sector jobs. To find the last time we saw that, you have to go all the way back to late 2005/early 2006. The chart below shows the three-month moving average of ADP Private Payrolls going back to its beginning in 2002. As shown, from a peak in mid-2014, the pace of job growth had been gradually drifting lower. However, after a double-bottom in October, job growth has been accelerating once again. At its current level of 253K, job growth is at its highest level since June 2014.
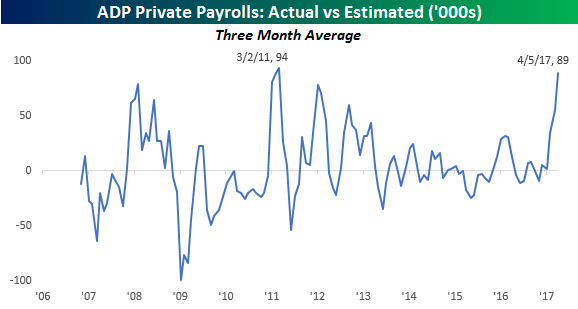
What’s so noteworthy about the recent pace of job growth is that it has caught economists almost completely off-guard. For example, each of the last three ADP prints have exceeded expectations by 75K or more for an average beat of 89K. Since economists started forecasting the monthly ADP print in 2006, the only other three-month period where ADP exceeded consensus estimates by a larger average amount was from December 2010 through February 2011. Not only is that strong, but it’s also ‘hard’ data. You know…the stuff that skeptics keep saying isn’t keeping up with so-called ‘soft’ survey data.
Bespoke CNBC Appearance (4/5)
Bespoke co-founder Paul Hickey appeared on CNBC’s Squawk Box on Wednesday to discuss the markets. To view the segment, click on the image below.

The Closer — The World’s Most Watched Range — 4/4/17
Log-in here if you’re a member with access to the Closer.
Looking for deeper insight on global markets and economics? In tonight’s Closer sent to Bespoke Institutional clients, we discuss the current range in the ten year yield, the resignation today of Richmond Fed President Lacker, US Census trade data for February, and factory orders data.
The Closer is one of our most popular reports, and you can sign up for a free trial below to see it!
The Closer is one of our most popular reports, and you can see it and everything else Bespoke publishes by starting a no-obligation 14-day free trial to our research!
Bespoke’s Consumer Pulse Report — March 2017
Bespoke’s Consumer Pulse Report is an analysis of a huge consumer survey that we run each month. Our goal with this survey is to track trends across the economic and financial landscape in the US. Using the results from our proprietary monthly survey, we dissect and analyze all of the data and publish the Consumer Pulse Report, which we sell access to on a subscription basis. Sign up for a 30-day free trial to our Bespoke Consumer Pulse subscription service here. With a trial, you’ll get coverage of consumer electronics, social media, streaming media, retail, autos, and much more.

B.I.G. Tips – The Tax Man Cometh
ETF Trends: International – 4/4/17
Oil continues to rebound on a trailing 5 day basis while South Africa (and GAF, which includes South African equities) while Swedish krona, European equities, the euro, and pharma all underperformed. Some strong performers in the US equity markets include Energy, Telecoms, and MLPs.
Bespoke provides Bespoke Premium and Bespoke Institutional members with a daily ETF Trends report that highlights proprietary trend and timing scores for more than 200 widely followed ETFs across all asset classes. If you’re an ETF investor, this daily report is perfect. Sign up below to access today’s ETF Trends report.
See Bespoke’s full daily ETF Trends report by starting a no-obligation free trial to our premium research. Click here to sign up with just your name and email address.
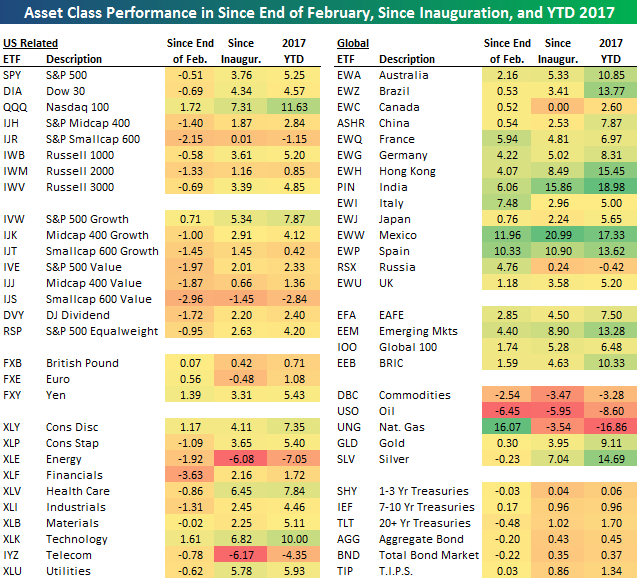
Bespoke’s Asset Class Performance Matrix
Below is a look at the recent performance of various asset classes using key ETFs that we track daily in our ETF Trends report. For each ETF in the matrix, we provide its percentage change since the end of February, since the close on Inauguration Day (1/20/17), and year-to-date so far for all of 2017.
The left side of the matrix contains mostly US equity related ETFs, while the right side contains international equity ETFs as well as commodity and fixed income ETFs. You’ll notice that international equity markets have performed much better than US equities recently. Many country stock market ETFs are up 5%+ since the end of February, while US equity ETFs are mostly in the red. The Nasdaq 100 (QQQ), the Consumer Discretionary sector (XLY), and the Technology sector (XLK) are the only areas of the US market that are up during this time period.
Year-to-date, the India (PIN) and Mexico (EWW) ETFs are up the most with gains of more than 17%, while natural gas (UNG) is down the most at -16.86%. Fixed income ETFs are up modestly year-to-date, but they’re down slightly since the end of February.