The Bespoke Report — 4/7/17
The Closer 4/7/17 – End of Week Charts
Looking for deeper insight on global markets and economics? In tonight’s Closer sent to Bespoke clients, we recap weekly price action in major asset classes, update economic surprise index data for major economies, chart the weekly Commitment of Traders report from the CFTC, and provide our normal nightly update on ETF performance, volume and price movers, and the Bespoke Market Timing Model.

The Closer is one of our most popular reports, and you can sign up for a free trial below to see it!
Click here to start your no-obligation two-week free Bespoke research trial now!
ETF Trends: Hedge – 4/7/17
The Philippines tracker ETF EPHE was the best performer of the last five trading days, rallying over 5%. Energy, Telecoms, and gold miners also outperformed while some US fixed income assets started to creep into the top 20. Biotech, South Korea, and banks got hit, while small cap stocks were some of the worst performers.

Bespoke provides Bespoke Premium and Bespoke Institutional members with a daily ETF Trends report that highlights proprietary trend and timing scores for more than 200 widely followed ETFs across all asset classes. If you’re an ETF investor, this daily report is perfect. Sign up below to access today’s ETF Trends report.
See Bespoke’s full daily ETF Trends report by starting a no-obligation free trial to our premium research. Click here to sign up with just your name and email address.
March 2017 Headlines
S&P 500 Quick-View Chart Book: 4/7/17
Consumer Pulse: Jobs Report
Each month, Bespoke runs a survey of 1,500 US consumers balanced to census. In the survey, we cover everything you can think of regarding the economy, personal finances, and consumer spending habits. We’ve now been running the monthly survey for more than two years, so we have historical trend data that is extremely valuable, and it only gets more valuable as time passes. All of this data gets packaged into our monthly Bespoke Consumer Pulse Report, which is included as part of our Pulse subscription package that is available for either $39/month or $365/year. We highly recommend trying out the service, as it includes access to model portfolios and additional consumer reports as well. If you’re not yet a Pulse member, click here to start a 30-day free trial now!
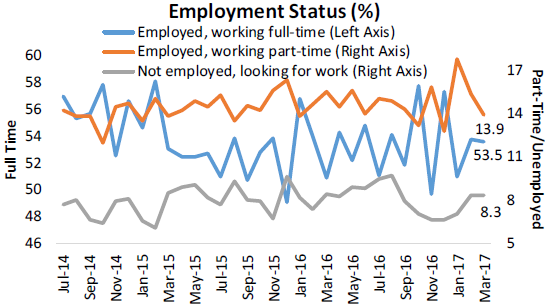
Our Consumer Pulse Report has seen some interesting movements relative to the March jobs report. Ahead of the much weaker than expected report, we saw some moderation in full-time employment after seeing some choppiness for the last few months. Similarly, part-time employment has pulled back slightly after seeing series highs in January. As the reported jobless rate nears “full employment” levels, our surveys saw the unemployment rate step up to 8.3% from the relatively low sub-7% level post-election. We would note that there does tend to be an upward bias to the “not employed, looking for work” series in Q1 of the year (March is a common time for the series to increase), but that the current move up does appear unusual even accounting for some seasonality.
To track additional consumer sentiment trends, click here to start a 30-day free trial to our Pulse service now!
Consumer Pulse: Home Improvement
Each month, Bespoke runs a survey of 1,500 US consumers balanced to census. In the survey, we cover everything you can think of regarding the economy, personal finances, and consumer spending habits. We’ve now been running the monthly survey for more than two years, so we have historical trend data that is extremely valuable, and it only gets more valuable as time passes. All of this data gets packaged into our monthly Bespoke Consumer Pulse Report, which is included as part of our Pulse subscription package that is available for either $39/month or $365/year. We highly recommend trying out the service, as it includes access to model portfolios and additional consumer reports as well. If you’re not yet a Pulse member, click here to start a 30-day free trial now!
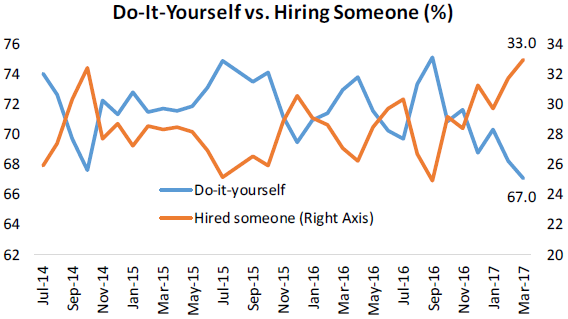
Our Consumer Pulse Report tracks a few different metrics across the home improvement space. One of those involves whether consumers tackling a project are doing it themselves or hiring an outside contractor. Recently, the percentage of do-it-yourselfers has declined to a series low while the percentage of consumers hiring someone has increased to a series high. Although a full two-thirds of consumers are still doing home improvement projects themselves, it is worth noting that this shift is representative of the elevated levels of spending on discretionary items and confidence towards personal finances. The increase in hiring outside help suggests that consumers are likely spending on more complicated projects and/or have enough disposable income to not be bothered doing it themselves.
To track additional consumer sentiment trends, click here to start a 30-day free trial to our Pulse service now!
Is Amazon Finally Starting To Destroy Jobs?
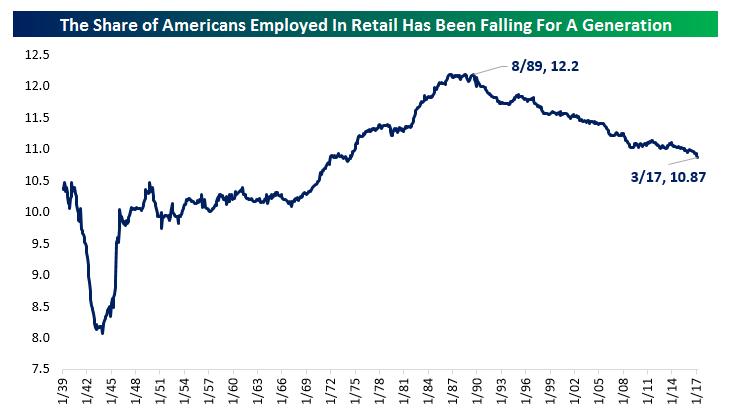
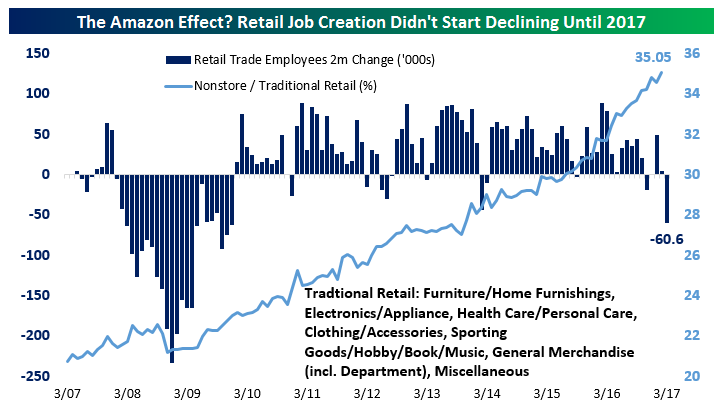
The rise of Amazon (and e-commerce more generally) has led to fears that retail employment is going by the wayside. That could be a problem: more than 10% of US nonfarm payrolls are found in retail jobs. But as the chart below shows, the share of Americans working in retail relative to total employment has been trending lower on a secular basis for almost 30 years after peaking at 12.2% in 1989. In other words, even if e-commerce is hurting retail jobs, it would be in the context of a labor market that was already shifting away from that kind of employment for two decades before online sales started to eat into demand for retailers.
As you’ll note in the chart above, retail employment has recently hit a rough patch. Below we show the two-month change in retail employment over the last ten years. As shown, the 60,600 job losses in retail for the last two months ending in March are the worst for the industry since the last recession. We would note, however, that Nonstore retailers (the category of monthly retail sales which capture the online-only e-commerce industry, including Amazon) are up to 35% of total “traditional” bricks and mortar retail sales. When comparing them, we stripped out categories less vulnerable to Amazon: food, eating/drinking places, auto and auto parts, and gasoline. The traditional retail industry has been dealing with an onslaught of competition for years without a significant impact on job creation. So is Amazon to blame for the last months of retail job destruction?
It’s not clear to us that traditional retail is responding only to losing market share. For instance, as shown in the chart below, the categories we consider “traditional” retail are still seeing YoY sales growth; true, that sales growth weakened dramatically through December of 2016, and that could be in part responsible for the weak jobs numbers the last couple of months. But it’s hard to imagine an industry seeing growing final demand (as indicated by the sales growth) just up and slashing workers. There’s no way to be sure, but at this point we think blaming Amazon for the most recent two retail industry jobs prints is a bit unfair. More likely: weather effects, random statistical noise, tighter labor markets, better opportunities in other industries, and a struggle to find high productivity workers led to the last two prints.
The Closer — Commodity And Currency Checkup — 4/6/17
Log-in here if you’re a member with access to the Closer.
Looking for deeper insight on global markets and economics? In tonight’s Closer sent to Bespoke Institutional clients, we take a look at commodity and FX returns over the past year, as well as testing how trend-following strategies using the 200-DMA of 9 different G10 currencies works out.
The Closer is one of our most popular reports, and you can sign up for a free trial below to see it!
The Closer is one of our most popular reports, and you can see it and everything else Bespoke publishes by starting a no-obligation 14-day free trial to our research!
Bespoke’s Sector Snapshot — 4/6/17
We’ve just released our weekly Sector Snapshot report (see a sample here) for Bespoke Premium and Bespoke Institutional members. Please log-in here to view the report if you’re already a member. If you’re not yet a subscriber and would like to see the report, please start a 14-day trial to Bespoke Premium now.
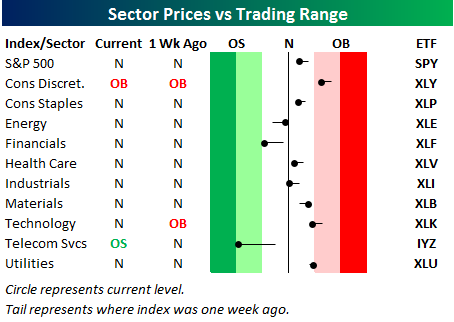
Below is one of the many charts included in this week’s Sector Snapshot, which highlights our trading range screen for the S&P 500 and ten sectors. The black vertical “N” line represents each sector’s 50-day moving average, and as shown, most sectors are currently trading just slightly above or below their 50-days. The market is currently as neutral as it has been in quite a while. That offers up opportunities on both the long and the short side! (Note that the red zone in the screen is considered overbought territory, while the green zone is considered oversold territory.)
To see our full Sector Snapshot with additional commentary plus six pages of charts that include analysis of valuations, breadth, technicals, and relative strength, start a 14-day free trial to our Bespoke Premium package now. Here’s a breakdown of the products you’ll receive.