Goldman Makes a Three Quarter Trip
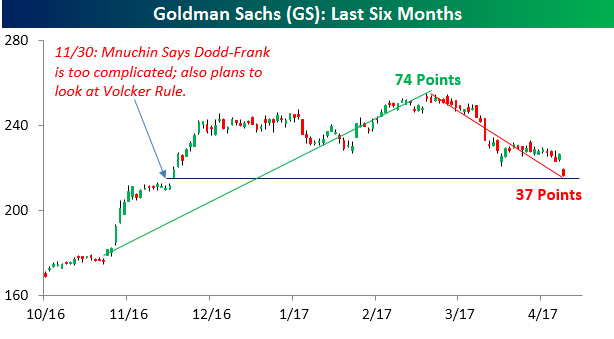
Shares of Goldman Sachs are under a ton of selling pressure today after the company reported weaker than expected earnings. With a decline of nearly 5% on the day, the stock is on pace for its second worst earnings reaction day since at least 2001. What makes today’s decline even more noteworthy is the fact that the stock has now given up half of its gains since Election Day. As shown in the chart below, from Election Day through its intraday high on 3/1, shares of Goldman rallied 74 points. Since then, the stock has now declined roughly 37 points through this morning’s low.
Following today’s decline, shares of Goldman are also sitting at a critical support level which coincides with the level they opened up at on 11/30 when Treasury Secretary Steve Mnuchin was officially nominated and made comments that Dodd-Frank is ‘too complicated’ and that he also planned to take a closer look at the Volcker Rule. A lot of the rally in the Financial sector was predicated on less in the way of regulatory burdens and to a lesser degree tax reform. With Goldman now giving up half of its post-election gains, the case can be made that much of the optimism over less regulation has been erased.
Start a 14-day free trial to unlock all of Bespoke’s market analysis.
Housing Starts Miss Forecasts
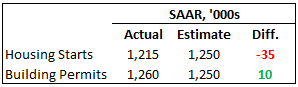 Housing data this morning came in mixed as Housing Starts missed expectations while Building Permits exceeded forecasts. As shown in the table to the right, starts came in 35K below consensus forecasts while permits exceeded forecasts by 10K. The table below breaks down today’s report in terms of both regions and size of units.
As far as unit sizes are concerned, both single and multi-family units were just about equally weak in March with both declining between six and eight percent. Building Permits saw more disparate results as single-family permits declined modestly while multi-family units surged over 13%. On a regional basis, the only area of the US where starts increased was in the Northeast. Meanwhile, permits saw a m/m increase in every region except the Midwest.

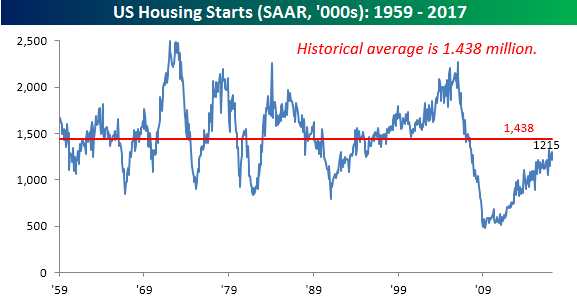
So how does the current level of starts compare to history? The chart below shows the historical monthly Housing Starts report going back to 1959. At this month’s level of 1.215 mln on a seasonally adjusted rate, Housing Starts are still more than 200K below their historical average going back to 1959, and haven’t seen even an average monthly reading once during the current expansion. The closest we came to average was last October when the SAAR monthly reading hit 1.32 million. What’s even more startling about this lack of a single ‘average’ monthly reading is that it doesn’t even account for the increase in population during this period. Decades ago, Housing Starts were routinely in the 1.5 million range even when the US population was not much more than half of the size that it is now. Start a 14-day free trial to unlock all of Bespoke’s financial markets research.
ETF Trends: Hedge – 4/18/17
South Africa remains an outperformer on a five day trailing basis, while the pain for commodities and industrial names (steel, metals and mining, oil names, transports) are major laggards. Gold miners, gold, silver, other currencies, long-term bonds, and REITs are all gainers as well, while banks are prominent on the underperformers list.

Bespoke provides Bespoke Premium and Bespoke Institutional members with a daily ETF Trends report that highlights proprietary trend and timing scores for more than 200 widely followed ETFs across all asset classes. If you’re an ETF investor, this daily report is perfect. Sign up below to access today’s ETF Trends report.
See Bespoke’s full daily ETF Trends report by starting a no-obligation free trial to our premium research. Click here to sign up with just your name and email address.
Bespoke CNBC Appearance (4/17)
Bespoke co-founder Paul Hickey appeared on CNBC’s Closing Bell on Monday to discuss the markets and earnings reports from Netflix (NFLX) and United Continental (UAL) as well as a number of other topics. To view the segment, please click on the image below.
Start a 14-day free trial to unlock all of Bespoke’s financial markets analysis.
Bespoke Stock Scores: 4/18/17
The Closer — China Credit, French Elections, Positioning Update — 4/17/17
Log-in here if you’re a member with access to the Closer.
Looking for deeper insight on global markets and economics? In tonight’s Closer sent to Bespoke Institutional clients, we take a look at Chinese credit statistics, French election polling ahead of their vote on Sunday, and update our positioning trackers for the CFTC’s Commitment of Traders in futures markets.

The Closer is one of our most popular reports, and you can sign up for a free trial below to see it!
The Closer is one of our most popular reports, and you can see it and everything else Bespoke publishes by starting a no-obligation 14-day free trial to our research!
Global Equity ETF Performance Since March 1st
The S&P 500-tracking SPY ETF is down 2.49% since its March 1st high. Below is an updated look at our country ETF trading range screen to highlight how the rest of the world has been trading over this time period. In terms of overbought/oversold levels, 13 of 30 countries remain overbought, while none are oversold. But the US is one of just a few countries trading below their 50-day moving averages (the black vertical “N” line in the screen). Just 5 of 30 countries are down since March 1st, with Brazil (EWZ) down the most followed by the US (-2.49%).
Start a 14-day free trial to see all of Bespoke’s premium earnings season analysis.
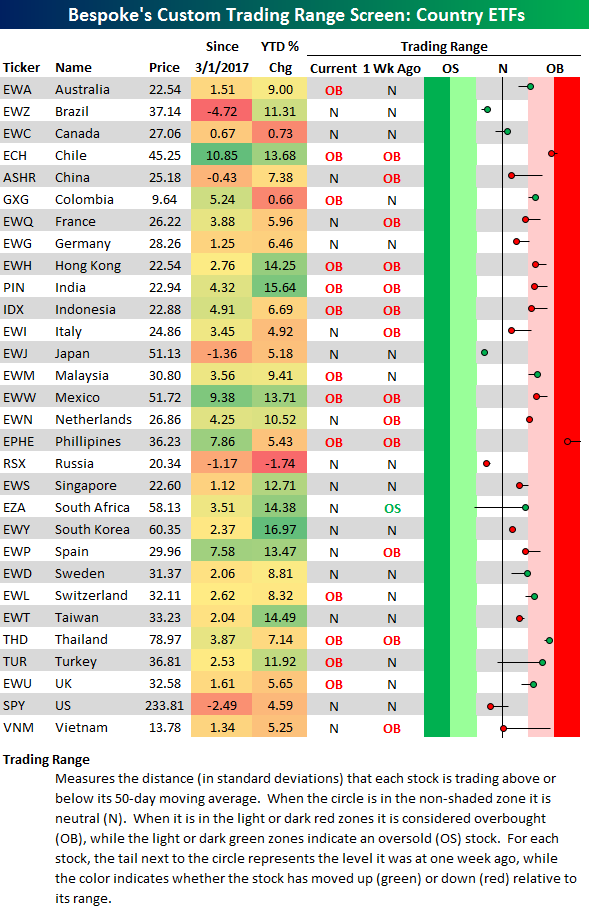
Chart of the Day: All Quiet on the Netflix Front
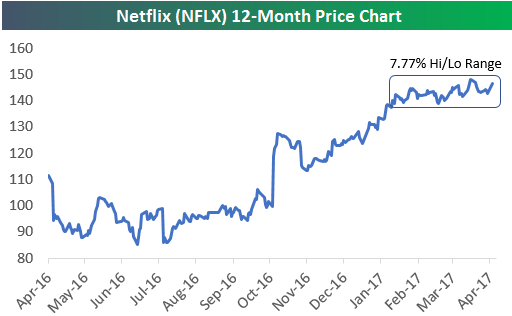
After posting gains of 19% and 4% on its last two earnings reaction days, Netflix (NFLX) is entering its April earnings report (tonight after the close) in what appears to be a hibernation phase. Over the last three months (60 trading days), NFLX has had a high/low closing range of just 7.77%. That’s actually the lowest 3-month high/low range that the stock has ever experienced dating back to its IPO in 2002.
Given the complete lack of volatility for a normally volatile stock, is NFLX set to explode higher or completely tank lower when it opens for trading tomorrow following earnings? It’s definitely likely to experience a big move one way or the other. Over NFLX’s 59 quarterly reports dating back to ‘02, the stock has experienced an average move of +/-13.87% on its earnings reaction days. That ranks it at the very top of large-cap stocks and 13th out of all US stocks in terms of earnings day volatility.
We pulled up NFLX’s historical reports using our Earnings Database (available to Bespoke Institutional and Exclusive members only) to see how the stock typically trades on its April earnings reports. We ended up finding some amazing stats. For a stock that has gained more than 13,000% since its IPO 15 years ago, the stock has actually struggled quite a bit on its earnings reaction days. In today’s Chart of the Day (available to all paid clients), we highlight a few key earnings stats for Netflix. Start a no-obligation two-week free trial to Bespoke’s research platform to see the report now.