The Closer — Industrial Production Ramps, Housing Flops, Mortgages Mixed — 5/16/17
Log-in here if you’re a member with access to the Closer.
Looking for deeper insight on global markets and economics? In tonight’s Closer sent to Bespoke Institutional clients, we review three data releases from the US today: industrial production from the Federal Reserve, residential construction from the US Census, and the MBA’s quarterly look at the mortgage market.

The Closer is one of our most popular reports, and you can sign up for a free trial below to see it!
The Closer is one of our most popular reports, and you can see it and everything else Bespoke publishes by starting a no-obligation 14-day free trial to our research!
Growth Stocks Crushing Value Stocks in 2017
Within the S&P 500, there’s an S&P 500 Growth index and an S&P 500 Value index. You can read more about how they’re constructed here. Below is a look at the performance of the two over the last year. As shown, Growth is outperforming Value by just over 3 percentage points, with Growth up 17.5% and Value up 14.3%. As you can see, though, there have been big trend shifts over the last six months following the election. Up until the election, the two indices had been performing inline with each other. In the four months after the election, though, Value significantly outperformed Growth. That outperformance has been completely erased since the start of March, however, as Value has trended lower while Growth has surged.
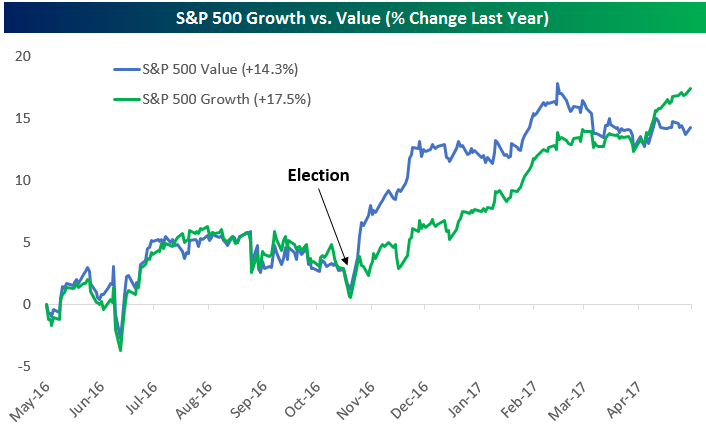
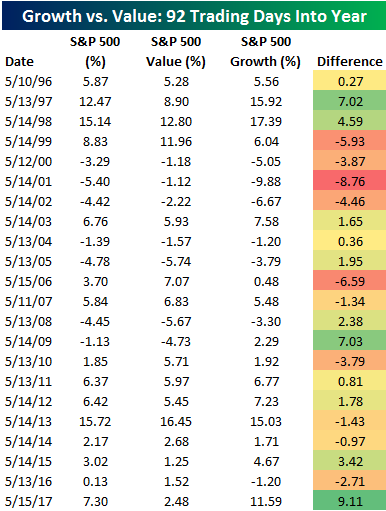
Through yesterday’s close, which was 92 trading days into 2017, the S&P 500 Growth index was up 11.59% YTD. The S&P 500 Value index was up just 2.48% YTD. Remarkably, the 9.11 percentage point spread between the two indices is the widest it has ever been at this point in the year since the indices were created back in 1995!
B.I.G. Tips – Death by Amazon – 5/16/17
Chart of the Day: Weak Housing Data But Foundation Still Intact
- Overall backdrop for the housing sector remains solid.
- 12-month average levels are still rising, which signals a recession is still not on the horizon.
- Housing stocks may be due for a breather here in the short-term.
 Read More
Bespoke Stock Scores: 5/16/17
ETF Trends: US Indices & Styles – 5/16/17
Miners continue to outperform on a trailing week basis with oil-related names also performing well. Emerging markets (Brazil, South Africa, Turkey, and Chinese large caps) are also doing well. Retail stocks are down almost 5% over the past week with media, the USD index, and some small cap indices also underperforming.

Bespoke provides Bespoke Premium and Bespoke Institutional members with a daily ETF Trends report that highlights proprietary trend and timing scores for more than 200 widely followed ETFs across all asset classes. If you’re an ETF investor, this daily report is perfect. Sign up below to access today’s ETF Trends report.
See Bespoke’s full daily ETF Trends report by starting a no-obligation free trial to our premium research. Click here to sign up with just your name and email address.
Disappointing News on the Home Front
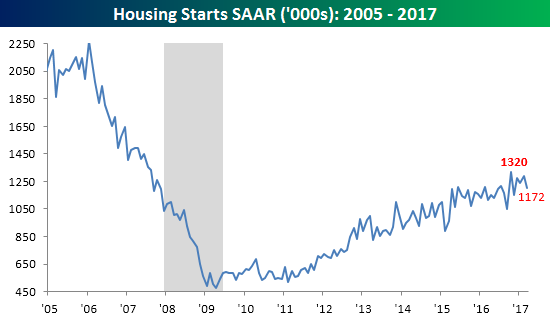
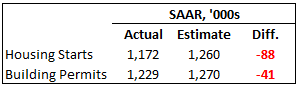 Although homebuilder sentiment came in stronger than expected for the month of May, data on Housing Starts and Building Permits for April came in soft. As shown in the table to the right, Housing Starts came in at a seasonally adjusted annualized rate (SAAR) of 1.172 million, which was 88K below consensus forecasts for a rate of 1.26 million. While that looks like a big miss on the surface, we would note that we have seen some volatile readings in this indicator over the last several months. As recently as last December, Housing Starts actually missed estimates by 140K. Building Permits also missed estimates in April, although the magnitude of the miss was considerably less.
If you’re not yet a Bespoke client, what are you waiting for? Start a 14-day free trial to gain access to our premium research offering.
Looking at Housing Starts, after making a lower high in February, current levels are now a little more than 11% off their cycle peak of 1.32 million from last October.
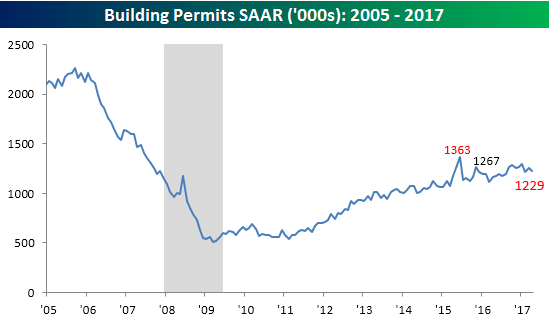
As mentioned above, Housing Starts have been considerably more volatile in recent months than Building Permits. This can also be seen in the chart below, which shows a much smoother progression from month to month. That said, Building Permits are also close to 10% off their cycle peak back in June 2015. But if you recall, that peak was induced somewhat artificially by a surge in filings for multi-family permits ahead of the expiration of tax credits which pulled activity forward.
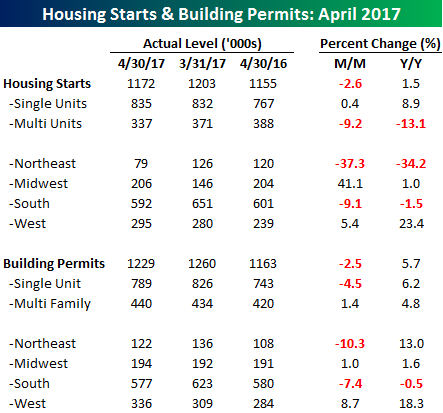
Finally, the table below breaks down both Housing Starts and Building Permits by type of unit and region. In terms of Housing Starts, what we found encouraging was the fact that all of the weakness was in multi-family units, which declined 9.2% m/m and 13.1% y/y. Single-family units, on the other hand, rose 0.4% m/m and 8.9% y/y. On a regional basis, weakness in this month’s report was primarily in the Northeast, where starts are down over 30% on both a m/m and y/y basis. In the case of Building Permits, we saw the opposite trend where all of April’s decline was due to weakness in single-family units, while multi-family units actually rose slightly.
The Closer — Canada Currency Part III, TICS Treasure Trove — 5/15/17
Log-in here if you’re a member with access to the Closer.
Looking for deeper insight on global markets and economics? In tonight’s Closer sent to Bespoke Institutional clients, we return our focus to the Canadian dollar, modeling its performance versus commodity prices, looking at positioning’s impact, and what the housing situation in Canada could lead to. We also update monthly tracking of Treasury International Capital flows data.
The Closer is one of our most popular reports, and you can sign up for a free trial below to see it!
The Closer is one of our most popular reports, and you can see it and everything else Bespoke publishes by starting a no-obligation 14-day free trial to our research!
Amazon Celebrates 20 Years
As you may have already seen, Amazon.com (AMZN) marked the 20th anniversary of its IPO today, and what a ride it has been. We’ve all seen the stats, but put simply, from its split-adjusted closing price of $1.958 on 5/15/1997, AMZN has rallied more than 48,800%. Yes, you read that correctly, 48,800%! In other words, a mere $100 invested in AMZN after its first day of trading would now be worth just under $49,000 today!
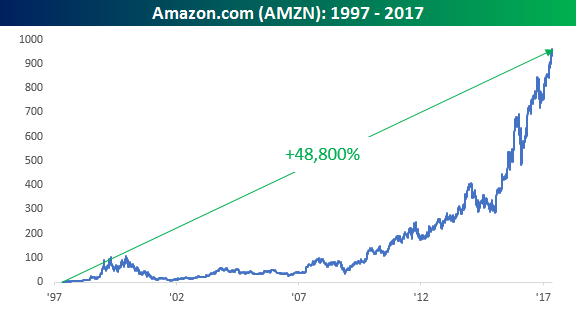
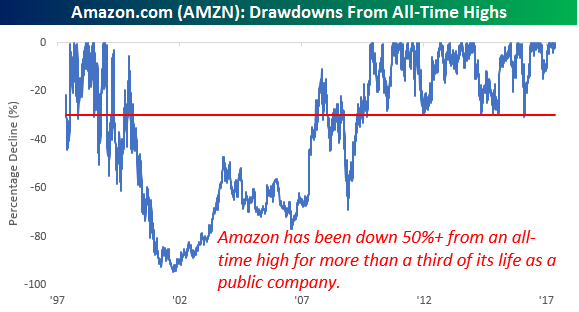
In retrospect, just buying and holding AMZN twenty years ago was a no-brainer, but for the twenty years that it has been trading, the hardest thing for most investors was probably not to sell. The chart below shows historical drawdowns from all-time highs for AMZN going back over the last 20 years. As you can see, the ride up for AMZN has been anything but smooth. While it may seem like AMZN does nothing but go up these days, it’s had plenty of rough patches. In fact, for a seven-year stretch from the Spring of 2000 to the Spring of 2007, AMZN was consistently more than 50% below its prior all-time high, and at one point it was down 95%. When you look back at the entirety of its life as a public company, AMZN has actually been at least 50% below its all-time high more than 36% of the time!
Even as recently as last March, the stock was down over 30% from an all-time high in what was the eighth such 30% drawdown (red line) since it came public. Based on today’s price, that would be equivalent to a decline of $289/share. These kinds of drawdowns look easy in retrospect, but they’re extremely hard to stomach in real time. A lot of investors in AMZN now would have a hard time swallowing a decline of that magnitude today. Would you?
If you’re not yet a Bespoke client, what are you waiting for? Start a 14-day free trial to gain access to our premium research offering.