ETF Trends: International – 3/29/17
Natural gas and Energy names have led the way in terms of trailing 1 week returns, with micro caps, Latin America, and biotech also performing well. Gold miners, frontier markets, and a number of developed market FX ETFs are the worst performers.

Bespoke provides Bespoke Premium and Bespoke Institutional members with a daily ETF Trends report that highlights proprietary trend and timing scores for more than 200 widely followed ETFs across all asset classes. If you’re an ETF investor, this daily report is perfect. Sign up below to access today’s ETF Trends report.
See Bespoke’s full daily ETF Trends report by starting a no-obligation free trial to our premium research. Click here to sign up with just your name and email address.
Looking For Action? S&P 1500 Most Volatile Stocks
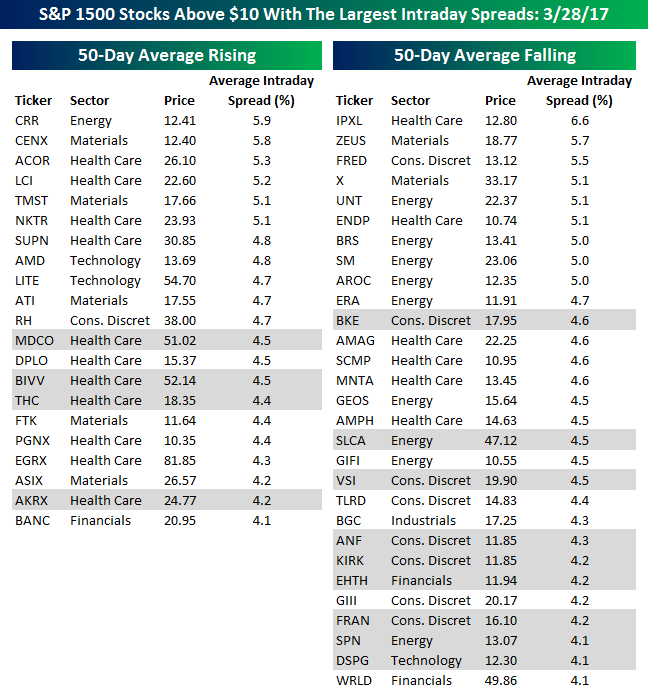
For traders with a short-term time horizon who are looking for big moves over a short period, we have updated our list of the S&P 1500 stocks trading above $10 that have the largest intraday high-low ranges (based on the average percent spread between the intraday high and low over the last 50 days). The stocks are grouped based on whether they have a rising or falling 50-day moving average (DMA). Stocks highlighted in gray are new to the list this month.
The S&P 500 may be within 2% of its all-time high, but the majority of stocks making up our list of most volatile stocks are currently in downtrends. As shown below, just 21 stocks have rising 50-day moving averages, while 29 have 50-DMAs that are in decline. Of the 50 stocks listed, just fifteen currently have average daily ranges of more than 5%, further illustrating how overall volatility is low. Also, of those fifteen stocks, just five are trading above $20 per share. In terms of sector representation, seven out of the eleven major sectors made the list. Health Care is the most well-represented sector with 17 stocks, followed by Energy with ten, and Consumer Discretionary with nine. Looking through the list, you’ve probably never heard of most of the names listed, but there are some household names including AMD, Restoration Hardware (RH), which are both in uptrends, as well as US Steel (X) and Abercrombie (ANF), which are in downtrends. Finally, given that most the stocks have relatively low share prices, they may be volatile, but they don’t necessarily have very large swings. That said, the highest priced stock listed (Eagle Pharma- EGRX) trades at over $80 per share, implying an average daily high/low range of just over $3 a day.
The Closer — Consumer Confidence Cruises — 3/28/17
Log-in here if you’re a member with access to the Closer.
Looking for deeper insight on global markets and economics? In tonight’s Closer sent to Bespoke Institutional clients, we take a look at extremely strong consumer confidence figures reported today.

The Closer is one of our most popular reports, and you can sign up for a free trial below to see it!
The Closer is one of our most popular reports, and you can see it and everything else Bespoke publishes by starting a no-obligation 14-day free trial to our research!
ETF Trends: Fixed Income, Currencies, and Commodities – 3/28/17
Mexico continues to outperform as the peso rallies; Mexican unemployment made a new low for the current cycle today. Biotech, European equities, Canada, and semiconductors are also up over the past week. Underperformers in the past five trading days include REITs, broker dealers, and commodity plays.
Bespoke provides Bespoke Premium and Bespoke Institutional members with a daily ETF Trends report that highlights proprietary trend and timing scores for more than 200 widely followed ETFs across all asset classes. If you’re an ETF investor, this daily report is perfect. Sign up below to access today’s ETF Trends report.
See Bespoke’s full daily ETF Trends report by starting a no-obligation free trial to our premium research. Click here to sign up with just your name and email address.
Bespoke Stock Scores: 3/28/17
FIZZ Fizzes
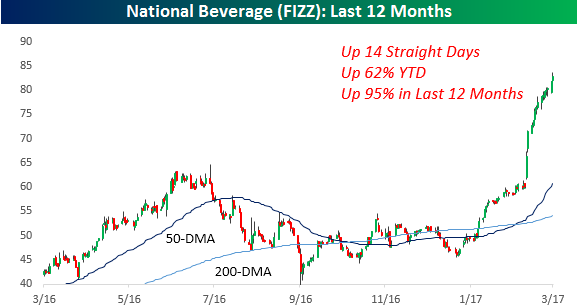
We’ll be the first to admit that there are a lot of nutty looking charts out there, but one of the contenders for craziest chart has to be National Beverage (FIZZ). After reporting solid earnings earlier this month, the stock has traded higher for 14 straight days, during which it has rallied 38%. In those 14 days, FIZZ has also closed higher than it opened every single day. YTD the stock is already up 62% and its one-year return is 95%. Not quite a double, but close. So what does National Beverage do that has resulted in such strong performance? An energy drink? A miracle medical elixir? A hangover free alcoholic cocktail? A liquid cannabis drink?
No to all of those. National Beverage’s specialty drink is good old fashioned seltzer water. Sure, it’s a trendy looking can and name, but it’s still seltzer water – the same stuff you can buy at the supermarket for under 50 cents a liter. You have to give the company credit, though, because if they’ve managed to be this successful on the back of selling seltzer water, they deserve every penny. It also doesn’t hurt that three-quarters of the company’s outstanding shares are held by the company’s founder, which doesn’t leave a whole lot of shares left to trade in the secondary market.
Consumer Confidence – It’s All About the Income
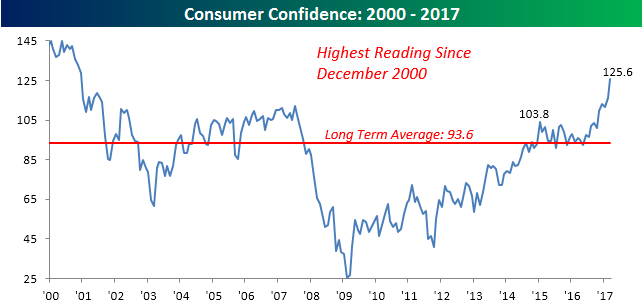
Today’s Consumer Confidence report for the month of March was impressive on a lot of fronts. Besides the fact that it was the fifth biggest beat relative to expectations for the headline index since 1999 and both Present Situation and Expectations saw healthy increases, confidence levels are also now comfortably above the highs we saw during the prior expansion from 2003 through 2007. That breaks what had been a trend of lower highs in confidence that formed from the peak Consumer Confidence readings in the 1990s.
If there was one concerning aspect of the report, though, it was the factors that drove confidence levels higher. The chart below compares Consumer Confidence based on consumers with income levels of more than $50K and between $35K and $50K. As shown, while higher income Americans saw their confidence levels surge to the highest levels since late 2000, confidence among consumers with more modest incomes actually declined and has yet to exceed the peak levels we saw from the last cycle.
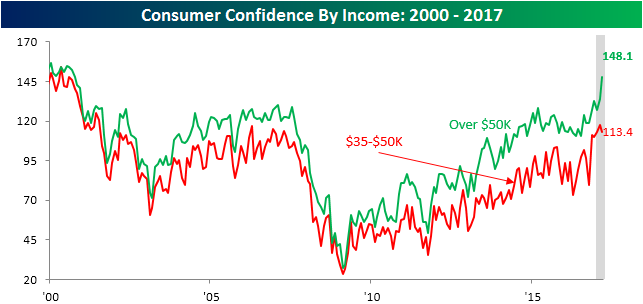
Chart of the Day – Consumer Confidence Blowout
To say that this morning’s Consumer Confidence report was better than expected would be a major understatement. With economists expecting the headline index to fall slightly to 114.0, the actual reading blew the roof off of estimates coming in at 125.6, which was the best reading since December 2000. In terms of how the report came in relative to expectations, today’s report was the fifth biggest beat since at least 1999 and just the seventh time that the actual reading has exceeded expectations by ten or more points.
In today’s Chart of the Day (available to all paid clients), we took a closer look at days where Consumer Confidence exceeded expectations by a large margin to see how the market traded on an intraday basis. Sign up for a free-trial below to check it out!

DJIA Nine-Day Losing Streaks
Yesterday may have been a moral victory for the bulls as the DJIA rebounded well off of its early lows, but at the end of the day, it still finished down for the eighth straight day. It was also the first day of the losing streak where the DJIA never traded in positive territory on an intraday basis. It’s still early today, but the DJIA is currently on pace to open modestly in the red once again, and if those declines hold until the end of the trading day, it will be the first time the DJIA has been down for nine straight trading days in over 39 years. A large percentage of people working on Wall Street today weren’t even alive the last time the DJIA had a nine-day losing streak.
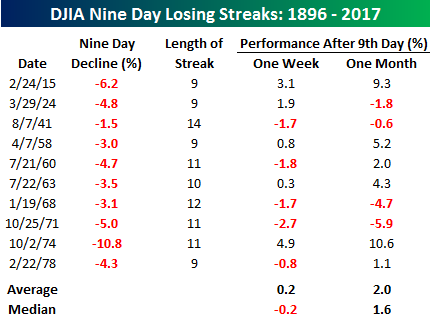
The table below lists the ten prior nine-day losing streaks that the DJIA has seen in its history going back to 1896. For each streak, we list the magnitude of the decline in the first nine days, how many trading days the losing streak lasted overall, as well as how the DJIA performed over the following week and month. The longest losing streak the DJIA has ever had was fourteen trading days, which was back in 1941. Like the current period, the DJIA’s decline during the initial nine days back then was very muted (1.51% compared to about 1.9% now). Interestingly enough, of the ten prior streaks where the DJIA was down for nine straight days, more often than not (six times) it went down for a tenth day as well, and half of the time (five times) it went on to decline for at least an eleventh day. Looking at returns going forward, the DJIA’s average one week change following the ninth straight day of losses has been a gain of 0.2% (median: -0.2%), while the average one month return has been a gain of 2.0% (median: +1.6%). If you are looking for the market to snap back quickly from here after nine straight days of declines, it is generally not the norm.
The Closer — Ready Patch to the Rescue — 3/27/17
Log-in here if you’re a member with access to the Closer.
Looking for deeper insight on global markets and economics? In tonight’s Closer sent to Bespoke Institutional clients, we review today’s rebound, look at how trends over the last six months compare to other periods in the past, and look at how earnings warnings so far this quarter compare to other quarters.
The Closer is one of our most popular reports, and you can sign up for a free trial below to see it!
The Closer is one of our most popular reports, and you can see it and everything else Bespoke publishes by starting a no-obligation 14-day free trial to our research!