June 2017 Headlines
Fixed Income Weekly – 7/5/17
Searching for ways to better understand the fixed income space or looking for actionable ideals in this asset class? Bespoke’s Fixed Income Weekly provides an update on rates and credit every Wednesday. We start off with a fresh piece of analysis driven by what’s in the headlines or driving the market in a given week. We then provide charts of how US Treasury futures and rates are trading, before moving on to a summary of recent fixed income ETF performance, short-term interest rates including money market funds, and a trade idea. We summarize changes and recent developments for a variety of yield curves (UST, bund, Eurodollar, US breakeven inflation and Bespoke’s Global Yield Curve) before finishing with a review of recent UST yield curve changes, spread changes for major credit products and international bonds, and 1 year return profiles for a cross section of the fixed income world.
In this week’s note, we take a look at the Eurodollar term structure and implications for the so-called “Greenspan conundrum”.

Our Fixed Income Weekly helps investors stay on top of fixed income markets and gain new perspective on the developments in interest rates. You can sign up for a Bespoke research trial below to see this week’s report and everything else Bespoke publishes free for the next two weeks!
Click here to start your no-obligation free Bespoke research trial now!
ETF Trends: International – 7/5/17
Steel, Agriculture, and Banks headline our list of best ETF performers this week. Oil continues its turnaround, although at a slower pace than the end of last week. Other notable outperformers include Financials, Metals, and Biotech. On the other hand, commodity ETFs such as Silver and Gold continue to underperform, which has been a common theme so far this year. Also, Utilities and Pharma round out the list of notable underperformers.

Bespoke provides Bespoke Premium and Bespoke Institutional members with a daily ETF Trends report that highlights proprietary trend and timing scores for more than 200 widely followed ETFs across all asset classes. If you’re an ETF investor, this daily report is perfect. Sign up below to access today’s ETF Trends report.
See Bespoke’s full daily ETF Trends report by starting a no-obligation free trial to our premium research. Click here to sign up with just your name and email address.
S&P 500 Sectors in First Half 2017
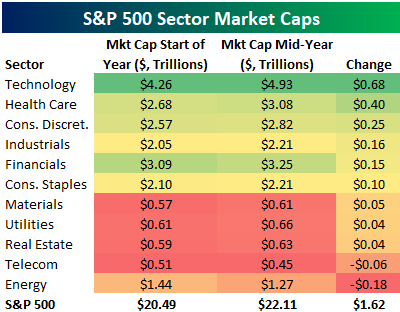
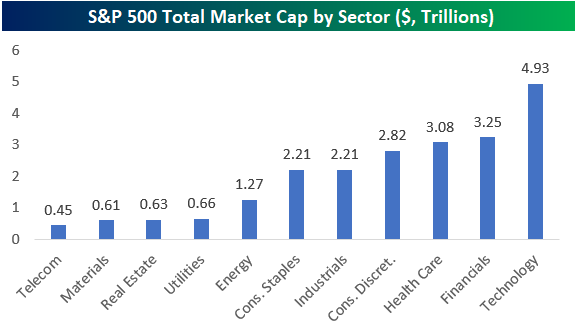
Below is a look at the change in market cap experienced by the S&P 500 and each of its eleven sectors in the first half of 2017. The members of the S&P 500 had a combined market cap of $20.49 trillion at the start of the year, and they added $1.62 trillion in the first half. This leaves the S&P 500’s current market cap at $22.11 trillion.
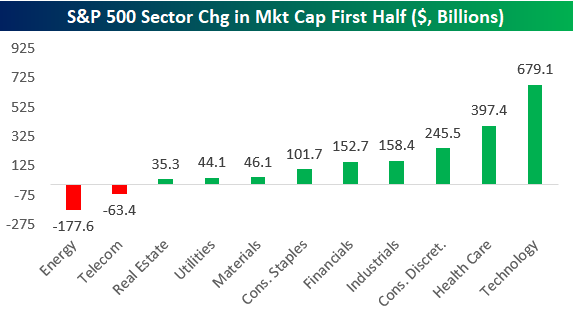
Of the eleven sectors, Technology gained the most in market cap at roughly $680 billion — moving from $4.26 trillion at the start of the year up to $4.93 trillion at the end of June. Health Care, Consumer Discretionary, Industrials, and Financials all added more than $150 billion in market cap.
Only two sectors — Telecom and Energy — saw a decline in their market cap during the first half. The Energy sector lost the most in market cap in the first half at -$177.6 billion.
Click here to start a no-obligation two-week free trial to our premium research platform.
The Closer — Mixed Indicator Monday — 7/3/17
Log-in here if you’re a member with access to the Closer.
Looking for deeper insight on global markets and economics? In tonight’s Closer sent to Bespoke Institutional clients, we review very mixed economic data from the US today, including ISM, vehicle sales, construction spending, and an unlikely piece of data from Mexico that speaks to the US economy’s current outlook. We also take a look at the huge rotation into Transports with the Dow Jones Transports index breaking out to new all-time highs today.
The Closer is one of our most popular reports, and you can sign up for a free trial below to see it!
The Closer is one of our most popular reports, and you can see it and everything else Bespoke publishes by starting a no-obligation 14-day free trial to our research!
B.I.G. Tips – 2017 First Half Decile Analysis
Bespoke Stock Seasonality: 7/3/17
ETF Trends: US Sectors & Groups – 7/3/17
Oil continues its strong performance among the world of ETFs that we track, up 7% over the past 5 days. Steel and Banks are also notable outperformers. On the other hand, Miners and Real Estate are underperforming, which has been a constant trend over the past couple sessions. Additionally, Biotech has slowed down after its recent strong performance, down just over 3% this week.
Bespoke provides Bespoke Premium and Bespoke Institutional members with a daily ETF Trends report that highlights proprietary trend and timing scores for more than 200 widely followed ETFs across all asset classes. If you’re an ETF investor, this daily report is perfect. Sign up below to access today’s ETF Trends report.
See Bespoke’s full daily ETF Trends report by starting a no-obligation free trial to our premium research. Click here to sign up with just your name and email address.
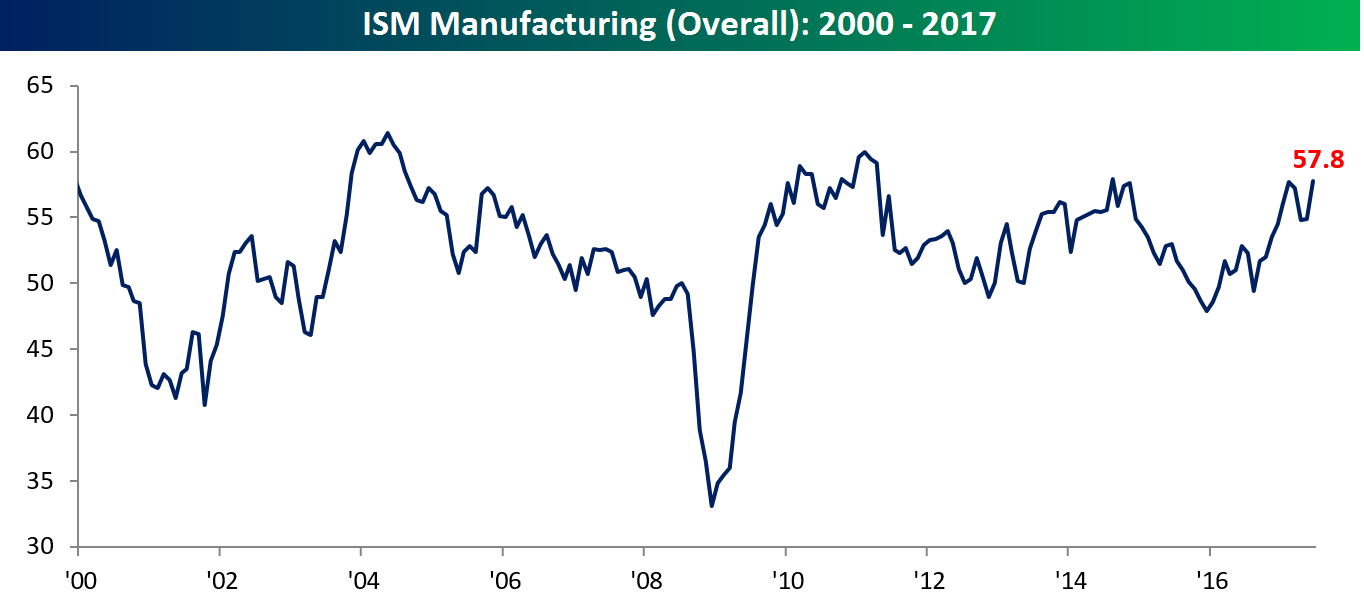
ISM Manufacturing Near a Six-Year High
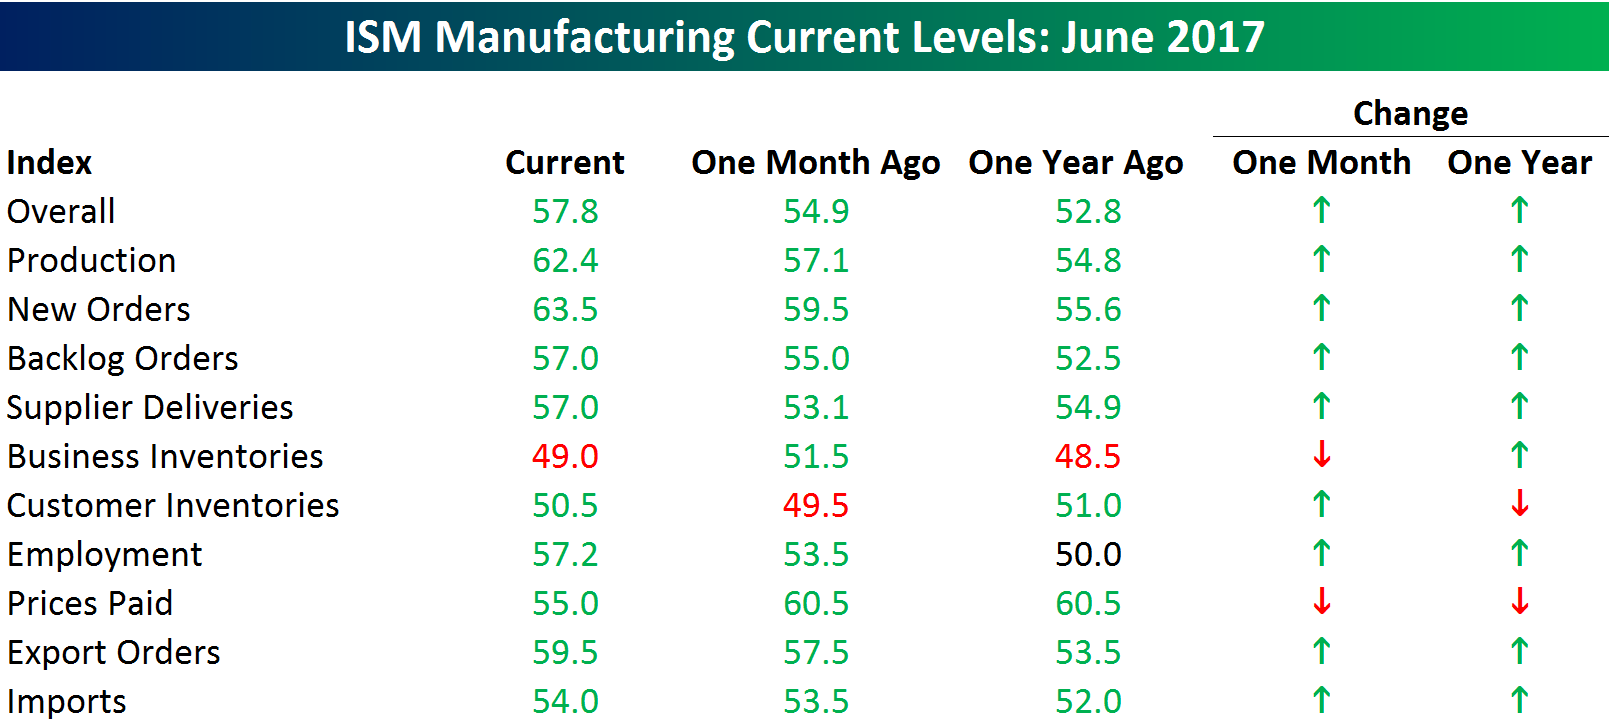
While economic data continues to come in mixed to generally weaker relative to expectations, the ISM Manufacturing report for June was very strong on an absolute basis and relative to expectations. While economists were expecting the headline index to come in at a level of 55.1 from last month’s level of 54.9, the actual reading came in at 57.8, which is just shy of the six-year high of 57.9 back from August 2014.
Want to see more analysis like this? Click here to start a no-obligation two-week free trial to our premium research platform.
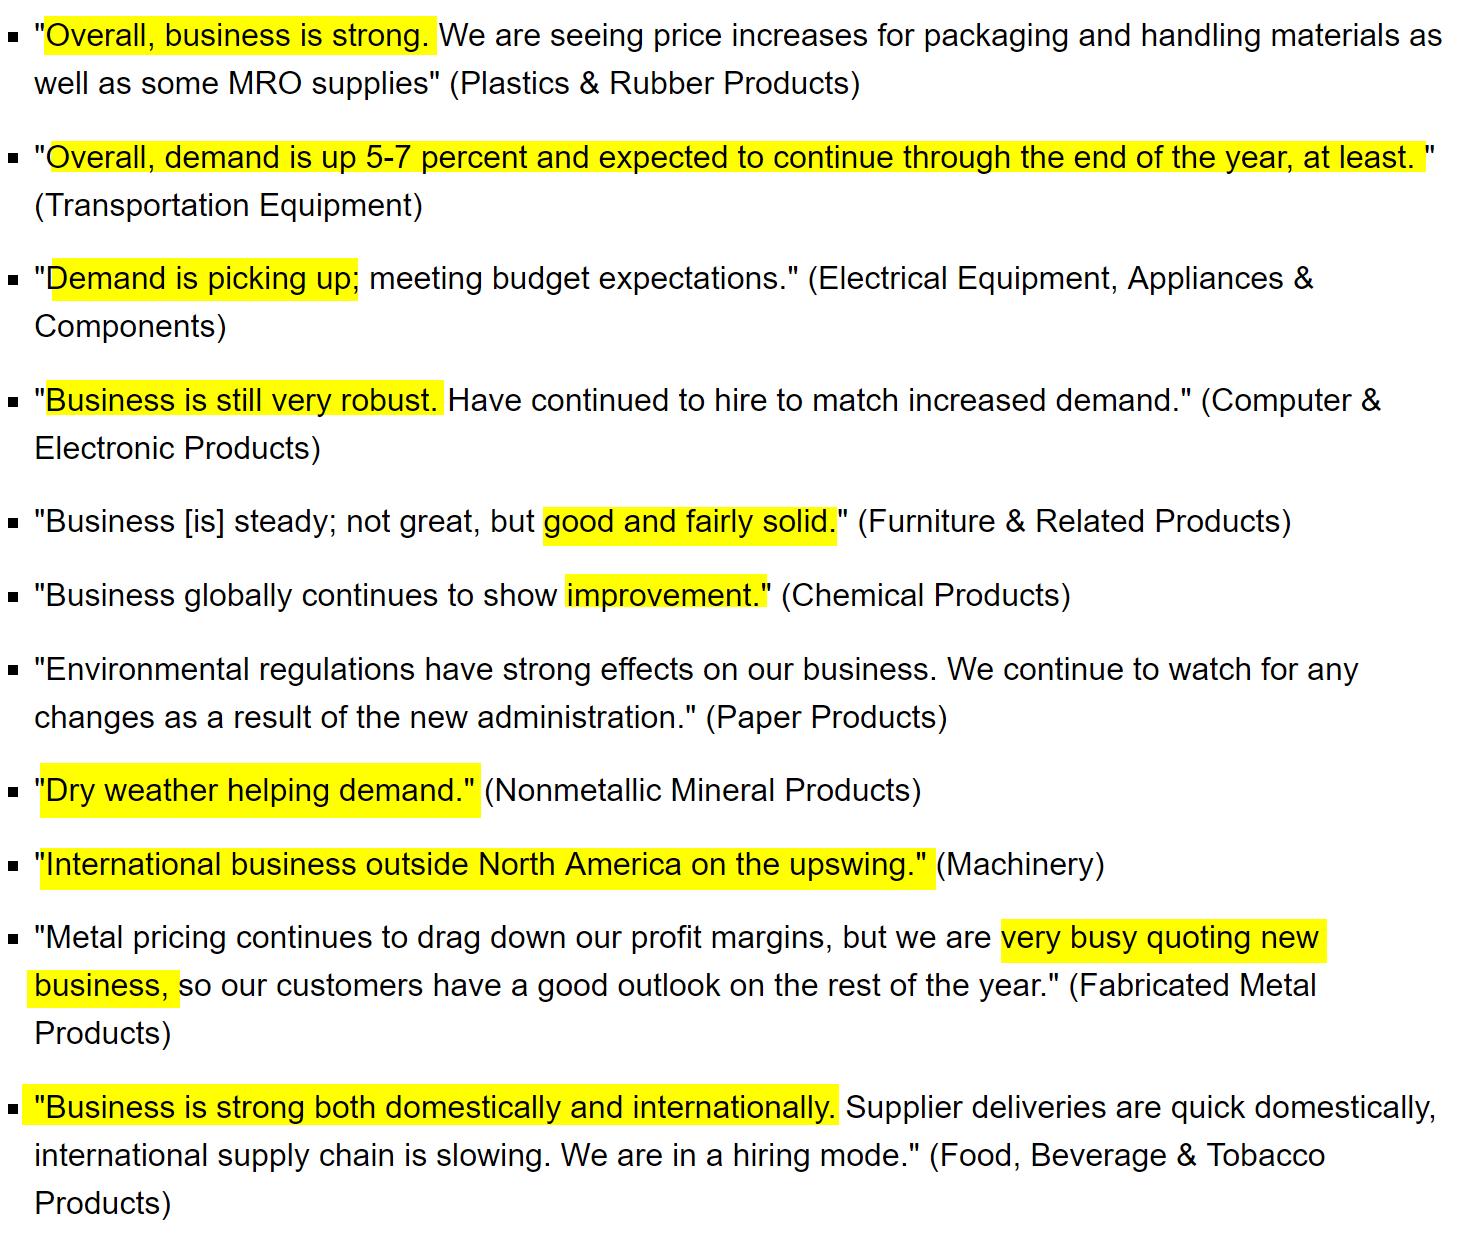
Not only was the headline index strong, but the commentary also paints a picture of robust activity. Below we have included a snapshot of some of the selected commentary from this month’s report. With the exception of one comment concerning environmental regulations, every other one suggests steady, solid, and or strong business activity.
The internals of the report further confirm that positive tone. Of the ten sub-indices in the report, all but two showed a m/m and y/y improvement in June. The biggest increases on a sequential basis were Production and New Orders. On the downside, Prices Paid was far and away the largest decliner in June.
July “Old Reliables”
Every Monday (or the first trading day of the week), Bespoke Premium and Institutional clients receive our S&P 500 Stock Seasonality report. Using the last ten years worth of price data, our Stock Seasonality report looks at the median returns for the S&P 500, its eleven sectors, and its 500 individual stocks. In the report, we highlight the five stocks in each sector that have historically been the best and worst performers over the next two weeks. For each stock, we also include information such as median returns, the percent of time each stock or sector is positive/outperforms the S&P 500, and its historical performance over the next two weeks for each of the last ten years. To see a sample, check out a recent report here. To receive regular access to the full S&P 500 Stock Seasonality report, sign up for a Bespoke Premium membership now.
With July kicking off today, we wanted to highlight S&P 500 stocks that have been the most consistent to the upside during the entire month over the last ten years. The table below lists the 13 stocks in the S&P 500 that have been up during the month of July in at least nine of the last ten years. Leading the way higher among the stocks listed is Celgene (CELG) which has seen a median gain of 11% with gains in every July except 2011 when it fell 1.7%. Behind CELG, another biotech — Alexion Pharma (ALXN) — has seen a median gain of 9.7% with gains in July in each of the last ten years.
Number three on the list is Wynn Resorts (WYNN), which has been up in every July over the last ten years except 2012. Over those ten years, the stock has seen a median gain of 7.4%. WYNN is digging itself into a bit of a hole to start the month as the stock is down 3% following weaker than expected revenue growth in Macau gaming revenues, but there are still another 30 days left in the month, so we shall see.
The fourth and fifth best-performing stocks are two that are going in seemingly different directions. Amazon.com (AMZN) has been a star for the last several months, and July also tends to be a good month as the stock has seen a median gain of 7.0% with gains in each of the last ten years except for 2014. Behind AMZN, IBM has been a proverbial stick in the mud for years now, but at least July has been good for the stock as it has seen a median gain of 5.4% with gains in every July except 2015 when it fell just 0.4%.
Obviously investors shouldn’t trade solely on the calendar, as macro or stock-specific events can come up and trump seasonal tendencies. That being said, there certainly is evidence that the market and many stocks do indeed follow seasonal patterns, so it pays to be aware of them
