Bespoke Brunch Reads: 7/23/17
Welcome to Bespoke Brunch Reads — a linkfest of the favorite things we read over the past week. The links are mostly market related, but there are some other interesting subjects covered as well. We hope you enjoy the food for thought as a supplement to the research we provide you during the week.
See this week’s just-published Bespoke Report newsletter by starting a no-obligation two-week free trial to our premium research platform.
Announcements
Introducing The Reformed Broker All Access by Josh Brown (The Reformed Broker)
Ritholtz Wealth Management CEO and noted market commentator Josh Brown announces his plans for @AllAccessTRB, part of Premo Social, a new social media service from Bespoke. [Link]
Investing
Brokers’ Call on Wall Street: Bye by Michael Wursthorn (WSJ)
A review of the move from wirehouse offices where brokers charge commissions for trades to the independent registered investment advisor model. [Link; paywall]
Wall Street Profits by Putting Investors in the Slow Lane by Jonathan Macey and David Swensen (NYT)
Fractions of a cent per trade incentivized by rebates to brokers can add up to billions in costs at scale. More importantly, the practice isn’t transparent, limiting the steps customers can take to prevent or avoid it. [Link; soft paywall]
Goldman Partners Mark End of Era as Stock Holding Drops Below 5% by Dakin Cambell (Bloomberg)
When Goldman IPO’d in May of 1999, more than 60% of the firm’s value was held by partners. As of the third of July, that number is down to less than 5%, its lowest ever. [Link; auto-playing video]
Business Models
The Business of Artificial Intelligence by Erik Brynjolfsson and Andrew McAfee (HBR)
A fantastic and comprehensive overview of the current AI space and what the outlook looks like, struck in easy to understand and realistic terms. [Link]
The Crazy Math Behind Drug Prices by Paul Barrett and Robert Langreth (Bloomberg)
In the complex US healthcare system, pharmacy benefit managers stand between drug companies and the entities that pay for drugs, like insurance companies, are the subject of new lawsuits alleging harm to consumers by uncompetitive behavior. [Link]
International Affairs
EU threatens to escalate Article 7 action against Poland by Arthur Beesley (FT)
With Poland’s Law & Justice Party attacking the independence of the country’s supreme court, the EU is considering steps to limit the attack on an independent judiciary. [Link; paywall]
An Early Sign India’s Huge Tax Revamp Is Working: Happy Truck Drivers by Corinne Abrams, Debiprasad Nayak, and Anant Vijay Kala (WSJ)
Reform to India’s tax system has removed regional taxes and replaced it with a national GDP, improving efficiency of movement for goods around the massive country. [Link; paywall]
Can the Fed and ECB Work Together To Reduce Imbalances? by Brad W. Setser (Council on Foreign Relations)
An argument that the ECB should focus on raising interest rates rather than reducing its balance sheet, having an optimal impact on the country’s currency and the imbalances in global current accounts. [Link]
Economic Dynamism
Older and Slower: The Startup Deficit’s Lasting Effects on Aggregate Productivity Growth by Titan Alon, David Berger, and Robert Dent (NBER Working Papers)
A unique paper design that shows productivity declines are likely driven in large part by falling turnover of US firms, also called the “startup deficit”. [Link; 37 page PDF]
Low-Income Earners See Weekly Pay Gain Faster Than Other Groups by Eric Morath (WSJ)
Wages for the lowest paid workers (those in the bottom decile of usual weekly earnings) are growing at the fastest pace in almost a decade, and faster than both median and top decile workers. [Link; paywall]
Crime and Punishment
Forget Silk Road, Cops Just Scored Their Biggest Victory Against The Dark Web Drug Trade by Thomas Fox-Brewster (Forbes)
This week the DoJ announced cooperative actions with international law enforcement agencies which shut down two major clearinghouses for both cryptocurrency and illicit drugs. [Link]
Archana
Why Banco Popular’s credit default swaps are getting messy by Robert Smith (FT)
The ECB put a Spanish bank into liquidation last month, but CDS linked to junior debt are now facing uncertain payouts because junior bondholders may have legal claims related to the liquidation. [Link; paywall]
Real Estate
2017 Profile of International Activity in US Residential Real Estate (National Association of REALTORS)
An excellent, chart-heavy review of purchases made by international buyers in the US market. Total dollar volume reached $153.0 billion in the twelve months ended March 2017, close to evenly split between residents and non-residents. [Link; 48 page PDF]
Ouch
Former $2 billion private equity fund now nearly worthless: WSJ by Dion Rabouin (Reuters)
An oil producer-focused private equity fund raised at the peak of the shale boom has collapsed, with investor holdings now worth nothing. [Link]
Long Reads
A Piece of the Action: Recent Books on the Digital Economy by Ron Hogan (LA Review of Books)
Long, winding words on the imagination of the digital economy that ends with a brilliant metaphor for network effect products using an episode of Start Trek. [Link]
Screaming About Stocks Into A Well: A Text Adventure by Noon Six Capital (Medium)
A play on a recent McSweeney’s piece, Noon Six playfully expresses what so many investors are thinking: futility and frustration in a world that we just don’t always understand. [Link]
On The Lighter Side
Supreme Court’s Junior Justice Has to Run the Cafeteria. Don’t Eat There by Jess Bravin (WSJ)
An endearing review of the cafeteria which serves the Supreme Court and the hazing new members of the court undergo by operating it. [Link; paywall]
The 100 Greatest Props In Movie History, And The Stories Behind Them (Thrillist)
An exhaustive list of the physical tapestry of movies, complete with discussions from members of the production team and stories about how they came into being. [Link]
Have a great Sunday!
The Closer: End of Week Charts — 7/21/17
Looking for deeper insight on global markets and economics? In tonight’s Closer sent to Bespoke clients, we recap weekly price action in major asset classes, update economic surprise index data for major economies, chart the weekly Commitment of Traders report from the CFTC, and provide our normal nightly update on ETF performance, volume and price movers, and the Bespoke Market Timing Model. This week, we’ve added a section that helps break down momentum in developed market foreign exchange crosses.

The Closer is one of our most popular reports, and you can sign up for a free trial below to see it!
Click here to start your no-obligation two-week free Bespoke research trial now!
The Bespoke Report — 7/21/17
S&P 500 Quick View Chart Book – 7/21/17
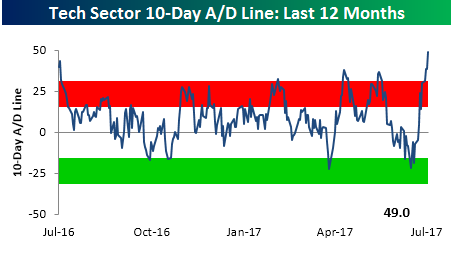
B.I.G. Tips – Tech Sector Breadth Explodes
The chart below appears in each week’s Sector Snapshots report and shows the 10-day advance decline line for the S&P 500 Technology sector over the last year. Throughout the month of June, we saw a steady decline in this reading as it drifted from extreme overbought to oversold levels. Since the beginning of July, however, the fireworks started to fly and breadth has come roaring back to levels not seen in at least a year.
Taking a longer term look at the Technology sector’s 10-day A/D line, would you believe that the reading through yesterday’s close was the fifth best single day reading on record? Also, the only other times we have ever seen a higher reading were also during the month of July. What is it about July and the Tech sector? In a B.I.G Tips report we just sent out to clients, we looked at prior extreme breadth readings for the Technology sector to see how it performed going forward. For anyone trying to decide whether to take profits or add exposure to the sector, the results are a must see!
If you are interested in obtaining this report, sign up for a monthly Bespoke Premium membership now!
ETF Trends: US Indices & Styles – 7/21/17
In this week’s edition of our ETF Trends report, Solar continues its strong performance among the world of ETFs that we cover, up just over 3% and topping our list of best performers for the second straight day. Silver, Media, and Biotech are also among the notable outperformers. Sweden, Transports, and Industrials are noteworthy underperformers, while the US Dollar makes its 3rd straight appearance on our worst performance list, down just over 1% on a 5 day basis.
 17-ETF-Trends.png” alt=”” width=”766″ height=”471″ />
Bespoke provides Bespoke Premium and Bespoke Institutional members with a daily ETF Trends report that highlights proprietary trend and timing scores for more than 200 widely followed ETFs across all asset classes. If you’re an ETF investor, this daily report is perfect. Sign up below to access today’s ETF Trends report.
See Bespoke’s full daily ETF Trends report by starting a no-obligation free trial to our premium research. Click here to sign up with just your name and email address.
The Closer — EUR Kiddin’ Me — 7/20/17
Log-in here if you’re a member with access to the Closer.
Looking for deeper insight on global markets and economics? In tonight’s Closer sent to Bespoke Institutional clients, we chart up monthly residential construction numbers. We also take a look at the strong performance of oil market data in the US of late, and an attractive technical setup.
The Closer is one of our most popular reports, and you can sign up for a free trial below to see it!
The Closer is one of our most popular reports, and you can see it and everything else Bespoke publishes by starting a no-obligation 14-day free trial to our research!
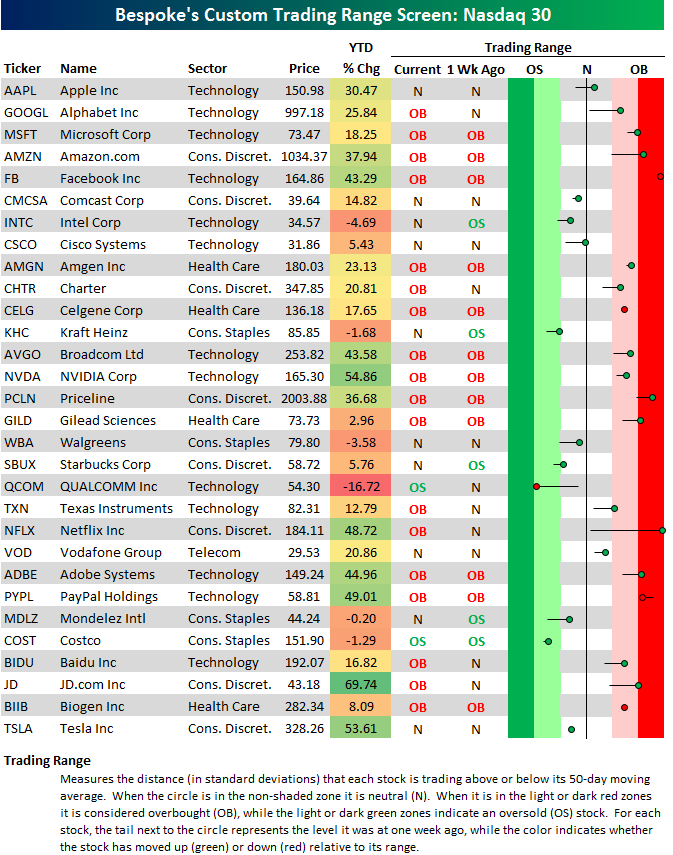
FANG+ Trading Range Screen
Below is our trading range screen for the 30 largest stocks in the Nasdaq 100 (sorted from largest to smallest). For each stock, the dot represents where it’s currently trading, while the tail end represents where it was trading one week ago. The black vertical “N” line represents each sector’s 50-day moving average, and moves into the red or green zones are considered “overbought” or “oversold.”
This screen allows you to quickly see how all of the “FAANG” stocks are trading in terms of upside or downside momentum. As you can see, the majority of stocks on the screen are currently in overbought territory, with Facebook (FB), Netflix (NFLX), Amazon.com (AMZN), and Priceline (PCLN) the farthest above their 50-day moving averages. Qualcomm (QCOM) is one of the only stocks that have headed lower within its trading range over the last week, and that’s due to extreme weakness in reaction to its earnings report today.
Year-to-date, you may be surprised to see JD.com (JD) up the most with a gain of 69%. NVIDIA (NVDA) and Tesla (TSLA) rank second and third.
Start a two-week free trial to Bespoke’s research platform to see our full offering.
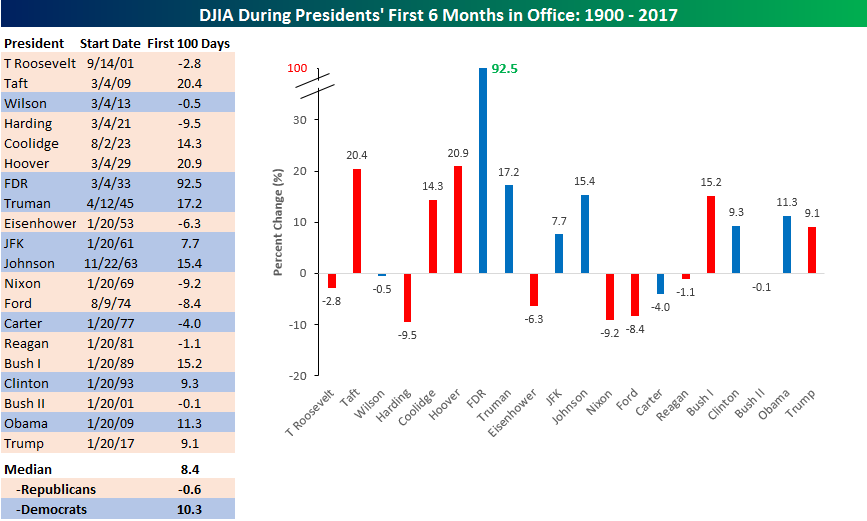
Trump’s First Six Months
It may be hard to believe, but depending on your perspective and/or political bent, it has already (or only) been six months since President Trump’s inauguration in January. With that in mind, we looked to see how the stock market’s return under Trump’s tenure stacks up relative to that of other US Presidents since the start of 1900. Have stock market returns really been as “yuge” as purported to be? The table and chart below help to answer that question, as it shows the historical returns of the DJIA during each President’s first six months in office.
There are a number of ways to interpret these results, but in the broadest sense, the 9.1% return of the DJIA during Trump’s first six months in office is really nothing to write home about. Of the 20 Presidents shown in the table and chart, Trump only outperforms the overall median (8.4) by less than one percentage point. Furthermore, plenty of other Presidents have seen much stronger returns during their first six months in office. The DJIA rose 92.5% during FDR’s first six months, while Taft and Hoover both saw the DJIA rally more than 20%. Even more recently, three of the last four US Presidents saw a stronger rally by the DJIA than Trump during their first six months in office. The only recent President to see a smaller gain in his first six months in office was the second President Bush.
While the DJIA’s performance under President Trump is right in line with the historical norm, it is much better than past Republicans. As shown at the bottom of the table, the median return of the DJIA for all Republican Presidents during their first six months in office was a decline of 0.6%, so Trump is outperforming here by a wide margin. Additionally, in the post-WWII period, the only Republican President that presided over a bigger gain in his first six months was the first President Bush. So far at least, the stock market’s performance during the President’s first six months in office compares more closely to the 10.3% median return that the DJIA has seen during the first six months of Democratic terms.
Finally, we would make note of two things. First, one could easily argue that the 9.1% gain so far under Trump is understated since the DJIA rallied “bigly” in the period from the election through the inauguration. That’s definitely true, but it’s hard to measure returns in this manner, since a number of Presidents listed weren’t actually elected. (i.e., Johnson, Ford, etc) Long story short, this is an imperfect way to measure returns, but it’s still standard across all Presidents. The second thing to note, of course, is that returns during a President’s first six months in office don’t always mean there are more gains to come! Take the first President Bush, for example. In his first six months in office, the DJIA rallied 15.2%; however, by the end of his term, the US economy was in a recession.
Click here to start a no-obligation two-week free trial to our premium research platform.
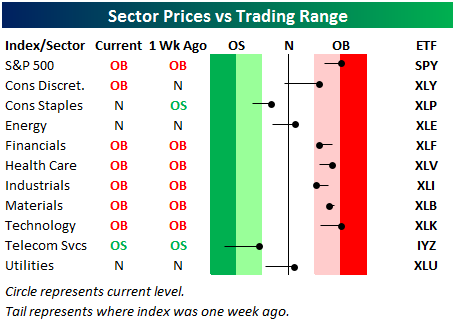
Bespoke’s Sector Snapshot — 7/20/17
We’ve just released our weekly Sector Snapshot report (see a sample here) for Bespoke Premium and Bespoke Institutional members. Please log-in here to view the report if you’re already a member. If you’re not yet a subscriber and would like to see the report, please start a 14-day trial to Bespoke Premium now.
Below is one of the many charts included in this week’s Sector Snapshot, which highlights our trading range screen for the S&P 500 and ten sectors. For each sector, the dot represents where it’s currently trading, while the tail end represents where it was trading one week ago. The black vertical “N” line represents each sector’s 50-day moving average, and moves into the red or green zones are considered overbought or oversold.
The S&P 500 and six sectors are currently overbought, with Tech the most extended to the upside after a massive run higher over the last week. Even the beaten down Energy sector moved back above its 50-day moving average this week.
To see our full Sector Snapshot with additional commentary plus six pages of charts that include analysis of valuations, breadth, technicals, and relative strength, start a 14-day free trial to our Bespoke Premium package now. Here’s a breakdown of the products you’ll receive.