Fixed Income Weekly – 5/17/17
Searching for ways to better understand the fixed income space or looking for actionable ideals in this asset class? Bespoke’s Fixed Income Weekly provides an update on rates and credit every Wednesday. We start off with a fresh piece of analysis driven by what’s in the headlines or driving the market in a given week. We then provide charts of how US Treasury futures and rates are trading, before moving on to a summary of recent fixed income ETF performance, short-term interest rates including money market funds, and a trade idea. We summarize changes and recent developments for a variety of yield curves (UST, bund, Eurodollar, US breakeven inflation and Bespoke’s Global Yield Curve) before finishing with a review of recent UST yield curve changes, spread changes for major credit products and international bonds, and 1 year return profiles for a cross section of the fixed income world.
In this week’s note, we model the value of the US dollar relative to interest rate differentials. We also highlight the tick up in global short-term interest rates, declining longer-term rates (especially breakevens), and the aggressive flattening at the front end of the short-term rates space.

Our Fixed Income Weekly helps investors stay on top of fixed income markets and gain new perspective on the developments in interest rates. You can sign up for a Bespoke research trial below to see this week’s report and everything else Bespoke publishes free for the next two weeks!
Click here to start your no-obligation free Bespoke research trial now!
ETF Trends: Hedge – 5/17/17
Precious metals and commodity-related plays have been the best performers over the last week with EM also doing well along with FX ETFs. With the yield curve flattening banks have been beaten down along wtih small caps and retail.

Bespoke provides Bespoke Premium and Bespoke Institutional members with a daily ETF Trends report that highlights proprietary trend and timing scores for more than 200 widely followed ETFs across all asset classes. If you’re an ETF investor, this daily report is perfect. Sign up below to access today’s ETF Trends report.
See Bespoke’s full daily ETF Trends report by starting a no-obligation free trial to our premium research. Click here to sign up with just your name and email address.
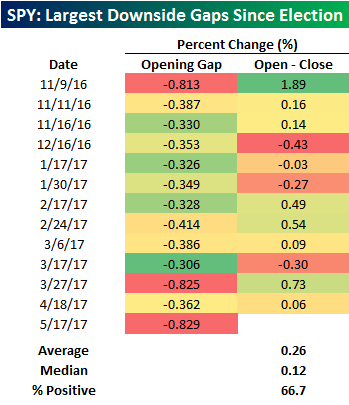
Largest Downside Gap Since the Election
It looks like news headlines have finally gotten to the market. Following leaks of the Comey Memo, US equity futures immediately traded lower, and while they stabilized overnight, sellers rushed in ahead of the open. As a result of the weakness, the S&P 500 tracking ETF SPY gapped down 0.829% at the open, making this the worst downside gap for the market since the election. As shown in the table, since Election Day last November, SPY has only gapped down more than 0.30% thirteen times and only two of those prior occurrences were more than half of one percent. Looking at the prior downside gaps, SPY traded higher from the open to close two-thirds of the time for an average gain of 0.26% (median: 0.12%). Will the buyers step in again this time to bail out the bulls? We wouldn’t bet against it. If we don’t bounce, however, it could be a sign that a more sustained pullback is at hand.
Top Performing Global Stocks in 2017
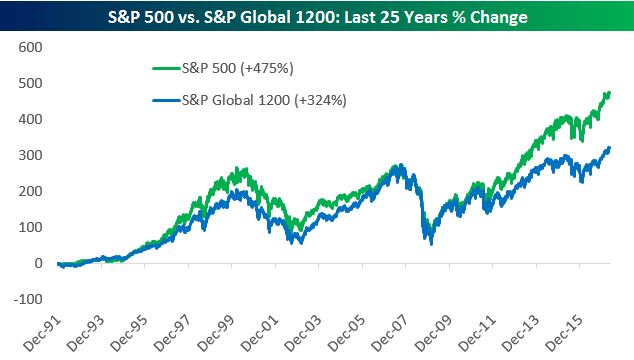
Below is a look at the performance of the S&P 500 versus the S&P Global 1200, which is an equity market index that captures roughly 70% of global market cap. The S&P Global 1200 contains stocks from the S&P 500, S&P Europe 350, S&P TOPIX 150 (Japan), S&P/TSX 60 (Canada), S&P/ASX All Australian 50, S&P Asia 50, and S&P Latin America 40.
Below is a look at the price performance (not total return) of the S&P 500 and S&P Global 1200 over the last 25 years. From 1992 through the early part of the current bull market, the two indices had performed roughly inline, but since the start of 2012, the US has significantly outperformed.
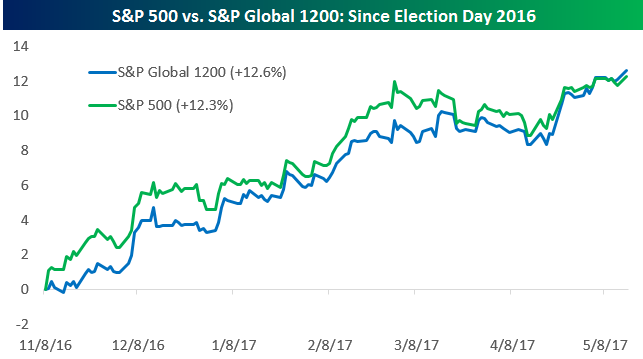
But foreign stock markets are making a comeback so far in 2017. While the US outperformed from the election through the end of 2016, the S&P Global 1200 has outperformed so far YTD. At this point the Global 1200 is actually up more than the S&P 500 since Election Day 2016. This is a trend that will likely continue if the Dollar continues to sink and issues out of Washington dominate the news.
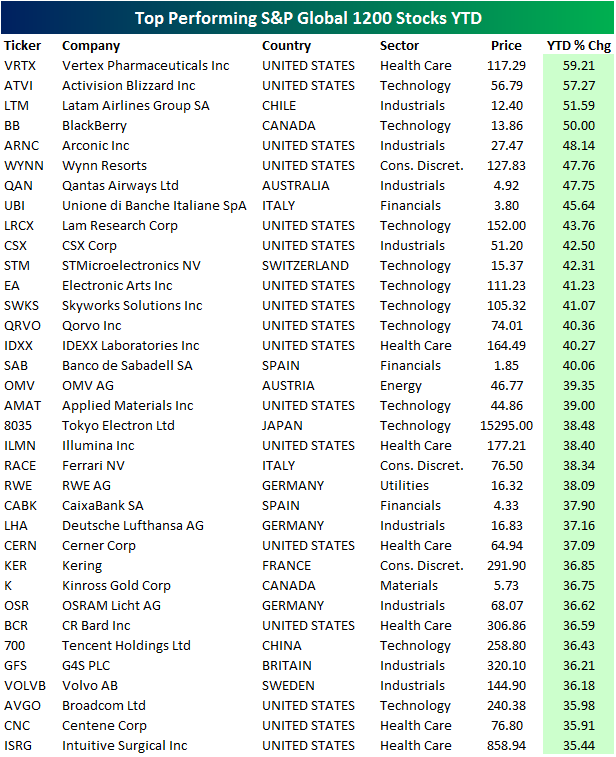
In terms of underlying index members, below is a look at the top performing stocks in the S&P Global 1200 so far in 2017 (based on local currency returns through 5/16). As shown, Vertex Pharma (VRTX) is up the most with a gain of 59.2% followed by Activision Blizzard (ATVI) — both US stocks. Latam Airlines Group (LTM) out of Chile is up the third most at +51.59%, while BlackBerry (BB) out of Canada ranks 4th at +50%. Yes…THAT BlackBerry.
US Dollar Gains: Going, Going, Gone
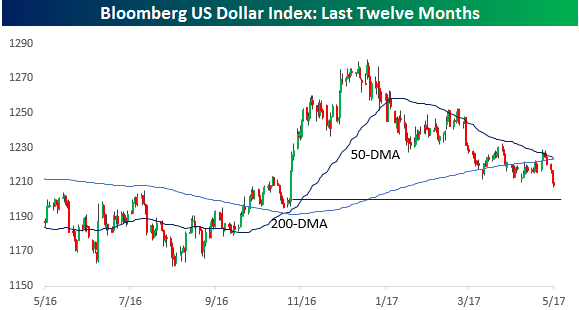
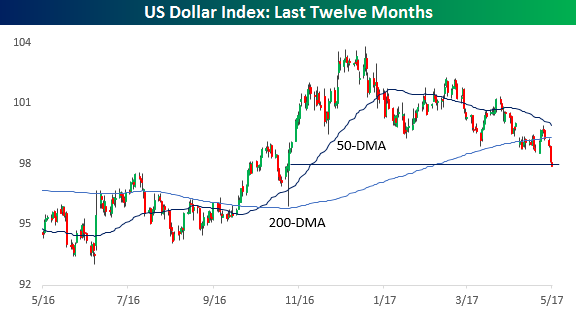
As another news leak out of Washington sullies the “Make America Great Again” sentiment that emerged in the wake of November’s election, by at least one measure, the US Dollar has given up all of its post-election gains. There are a number of ways to measure broad-based dollar strength (or weakness), but two of the most popular are the US Dollar Index and the Bloomberg US Dollar Index. First, the US Dollar Index is a weighted average of the dollar’s value relative to a basket of six different currencies (Euro, Japanese Yen, Pound sterling, Canadian dollar, Swedish krona, and Swiss franc). This index is traded on the IntercontinentalExchange and is often the most widely cited index of dollar strength. One of the shortcomings of this index, however, is that it hasn’t been re-balanced in years and has, therefore, become less representative of flows between the US and its major trading partners. The second and more representative representation of the dollar’s strength is the Bloomberg Dollar Index. Unlike the US Dollar Index, which hasn’t been rebalanced in years, this index rebalances every year and includes a more diverse basket of ten different currencies. While the indices are different, they will always move in the same direction.
Looking at the performance of both indices over the last year shows a similar pattern. In both cases, the dollar surged when Trump emerged victorious in November with a quick rally of over 5%. Since then, though, both have drifted lower, and after three weak days in a row, they’re at new post-election lows. In the case of the US Dollar Index, it has now given up all of its post-election gains.
Bespoke CNBC Appearance (5/17)
Bespoke co-founder Paul Hickey appeared on CNBC’s Squawk Box earlier today to discuss markets and the potential impact of news out of Washington. To view the segment, please click on the image below.
The Closer — Industrial Production Ramps, Housing Flops, Mortgages Mixed — 5/16/17
Log-in here if you’re a member with access to the Closer.
Looking for deeper insight on global markets and economics? In tonight’s Closer sent to Bespoke Institutional clients, we review three data releases from the US today: industrial production from the Federal Reserve, residential construction from the US Census, and the MBA’s quarterly look at the mortgage market.
The Closer is one of our most popular reports, and you can sign up for a free trial below to see it!
The Closer is one of our most popular reports, and you can see it and everything else Bespoke publishes by starting a no-obligation 14-day free trial to our research!
Growth Stocks Crushing Value Stocks in 2017
Within the S&P 500, there’s an S&P 500 Growth index and an S&P 500 Value index. You can read more about how they’re constructed here. Below is a look at the performance of the two over the last year. As shown, Growth is outperforming Value by just over 3 percentage points, with Growth up 17.5% and Value up 14.3%. As you can see, though, there have been big trend shifts over the last six months following the election. Up until the election, the two indices had been performing inline with each other. In the four months after the election, though, Value significantly outperformed Growth. That outperformance has been completely erased since the start of March, however, as Value has trended lower while Growth has surged.
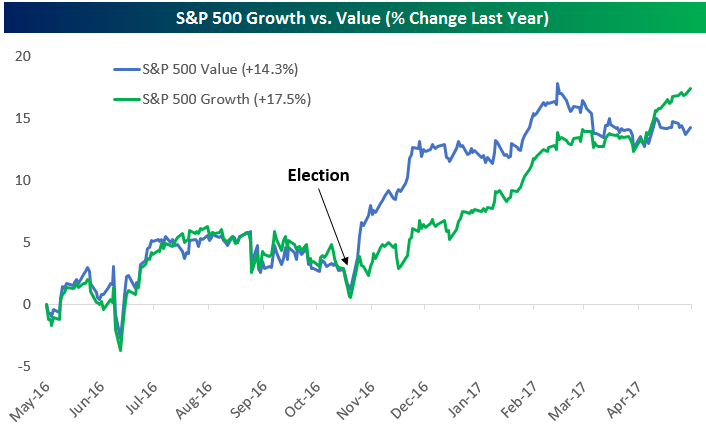
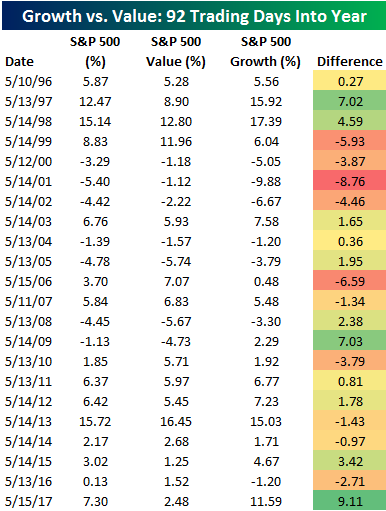
Through yesterday’s close, which was 92 trading days into 2017, the S&P 500 Growth index was up 11.59% YTD. The S&P 500 Value index was up just 2.48% YTD. Remarkably, the 9.11 percentage point spread between the two indices is the widest it has ever been at this point in the year since the indices were created back in 1995!
B.I.G. Tips – Death by Amazon – 5/16/17
Chart of the Day: Weak Housing Data But Foundation Still Intact
- Overall backdrop for the housing sector remains solid.
- 12-month average levels are still rising, which signals a recession is still not on the horizon.
- Housing stocks may be due for a breather here in the short-term.
 Read More