ETF Trends: Hedge – 5/24/17
Metals and mining have quietly bounced and lead ETFs we track over the last 5 days, with oil, Austria, and emerging markets also doing well. Brazil remains an underperformer despite it’s 10% bounce from the open last Thursday. Gold miners, India, and retail have all underperformed.

Bespoke provides Bespoke Premium and Bespoke Institutional members with a daily ETF Trends report that highlights proprietary trend and timing scores for more than 200 widely followed ETFs across all asset classes. If you’re an ETF investor, this daily report is perfect. Sign up below to access today’s ETF Trends report.
See Bespoke’s full daily ETF Trends report by starting a no-obligation free trial to our premium research. Click here to sign up with just your name and email address.
The Closer — New Home Sales: More Starts Ahead — 5/23/17
Log-in here if you’re a member with access to the Closer.
Looking for deeper insight on global markets and economics? In tonight’s Closer sent to Bespoke Institutional clients, we review new home sales data updated today by the US Census, Richmond Fed Manufacturing and Services data, global Flash PMIs from Markit, and a series of data releases today from Brazil and Mexico.

The Closer is one of our most popular reports, and you can sign up for a free trial below to see it!
The Closer is one of our most popular reports, and you can see it and everything else Bespoke publishes by starting a no-obligation 14-day free trial to our research!
Most of World Still Overbought
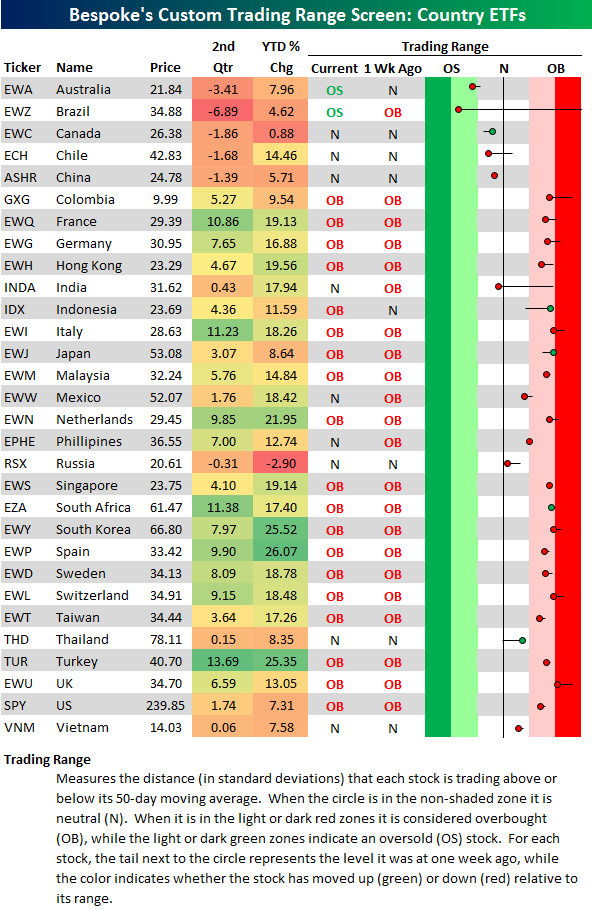
Below is an updated look at our country trading range screen, which gives viewers a quick look at where global equity markets are trading within their normal ranges. The screen includes ETFs for 30 of the largest country equity markets. The black vertical “N” line represents each ETF’s 50-day moving average, and moves into the red or green zones are considered overbought or oversold.
As you can see, the majority of country ETFs are trading in overbought territory, but most overbought countries are slightly lower today than they were a week ago at this time. The big movers to the downside over the last week have been Brazil (EWZ) and India (INDA). Last week at this time, Brazil was the most overbought country in the world, while now it’s the most oversold. India was overbought as well last week at this time, but over the past five trading days it has actually moved below its 50-day moving average.
In terms of price performance, France (EWQ), Italy (EWI), South Africa (EZA), and Turkey (TUR) have done the best so far in Q2, while Brazil (EWZ), Australia (EWA), and Canada (EWC) have done the worst.
Start a two-week free trial to Bespoke Institutional today.
General Motors Generally Depressed
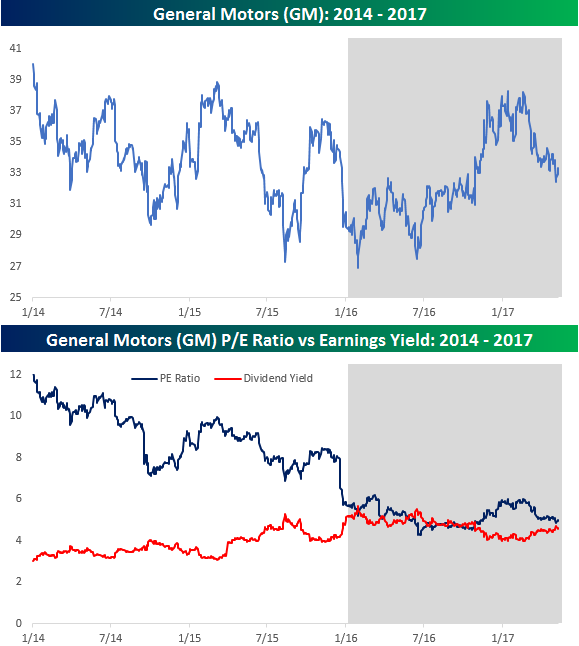
Times have been tough lately for US automakers not named Tesla (TSLA). Yesterday, Mark Fields resigned as Ford (F) CEO after the company’s share price declined from $17+ to $11 during his tenure. For General Motors (GM), things haven’t been much better. With just a 9% gain in the last year and a decline of 4.5% YTD, the stock has been a big underperformer versus the broader market of late. As just one example of how out of favor GM has become, the stock is currently trading for just 5x trailing earnings and has a dividend yield of 4.6%! It’s not often that you see a stock yield nearly as much as its P/E ratio. When this is the case, it either means that the market is expecting earnings to decline (which will push up the P/E ratio) or the dividend to decline, which will lower the yield. In the case of GM, though, the stock has been yielding nearly as much or more than its earnings multiple for quite some time now (shaded area in chart). Late last year, the stock rallied, which helped to push the spread between the P/E ratio and the yield wider, but as concerns over a peak in US auto sales have increased, the stock has come under renewed pressure, causing a narrowing of the spread.
Like what you see? Start a 14-day free trial to Bespoke’s premium research for instant access to our entire suite of offerings.
Drivers, Start Your Engines. It’s Driving Season
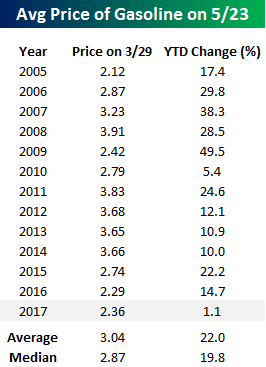 This upcoming weekend marks the unofficial start to the summer season, and with that Americans will start hitting the roads more frequently to go to the beach, start a vacation, or just barbecue with friends. As the summer driving season approaches, we wanted to provide a quick update on where gas prices currently stand relative to prior years at this time. Through today, the average national price of a gallon of gasoline sits at $2.36, which is up 1.1% YTD. That’s great news for US consumers because in terms of both price level and price change, gas prices are below average. For starters, let’s look at the current level of prices. Since 2005, there have only been two other years (2005 and 2016) where gas prices were lower heading into Memorial Day weekend. What’s even more notable, though, is the YTD change in gas prices. With just a 1.1% gain, it is the smallest YTD change in gas prices since 2005 and one of only two years where the YTD change was up less than 10%.
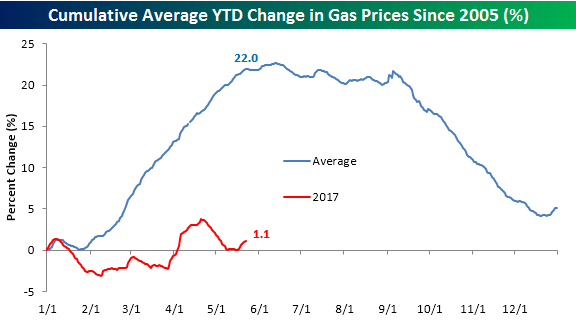
The chart below shows the subdued level of gas prices this year compared to prior years. In it, we show the YTD change in the national average price compared to a composite of the average YTD change in gas prices for all years since 2005. Here you can see the wide disparity between an average year and 2017. Even more important is that the 1.1% YTD gain we have seen this year came during the time of year when prices are normally the strongest. So if this is the best gas prices could do, what do they have in store in the second half when prices are typically seasonally weak.
Like what you see? Start a 14-day free trial to Bespoke’s premium research for instant access to our entire suite of offerings.
Finally, the fact that gas prices have essentially stopped rising this year has really caused the y/y change in prices to dramatically slow down. After spiking up to a peak of over 34% earlier this year, the y/y change has slowed to just 3.46% as the base effects of low prices from early 2016 have been worn off.

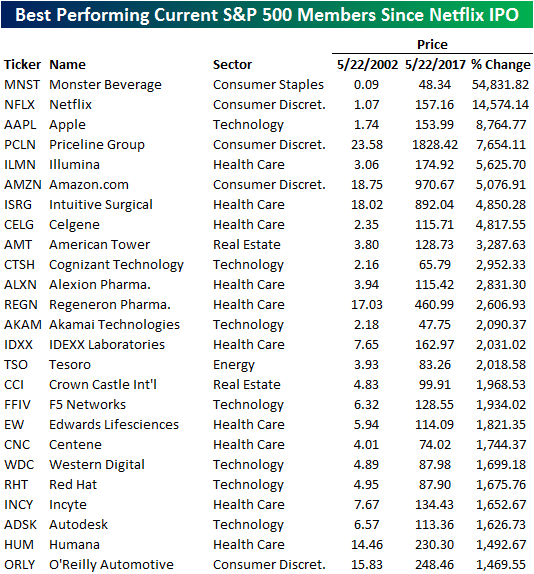
Best and Worst Since Netflix (NFLX) IPO
In a couple of posts yesterday, we discussed the meteoric rise in Netflix (NFLX) since its IPO (here and here). Today, we wanted to see how NFLX’s performance over the last 15 years compares to the performance of other current S&P 500 members during that same span. With a gain of over 14,500%, NFLX is obviously one of the top performers, but what may surprise you is that a move of that magnitude does not rank at the top of the list. The title for best performing stock over the last 15 years actually belongs to Monster Energy (MNST), which has actually more than tripled the return of NFLX, rallying 54,800%! That’s right, $100 invested in MNST 15 years ago would be worth just under $55,000 today.
As the names in the table below illustrate, the list of winners is heavily populated with stocks from the Technology sector (7 of 25). That doesn’t even include NFLX, or Priceline (PCLN), or Amazon.com (AMZN), which one could argue are just as much Tech stocks than they are Consumer Discretionary. It also illustrates how blurry the line has become between Technology and other sectors in the last several years. True, all three stocks sell items that involve discretionary purchases on the part of the consumer, but without a heavy focus on technology and innovation, none of these companies would be anywhere near where they are today. Also, Illumina (ILMN), which has rallied over 5,000%, is classified as Health Care. No argument there, but for a company that has been at the forefront of sequencing the human genome, that also involves just as much technology as it does medicine.
Like what you see? Start a 14-day free trial to Bespoke’s premium research for instant access to our entire suite of offerings.
To the downside, the list of stocks below contains current S&P 500 members that are down over the last 15 years. Leading the way to the downside, AIG, Citigroup (C), and Transocean (RIG) are down more than 80% over the last 15 years, and when you think about it, the fact that these stocks have been such losers over the last decade and a half and yet still manage to remain in the S&P 500 is a feat in and of itself. Another notable loser is Ford Motor (F), which is down close to 40%. The poor performance of F’s stock price is probably one big reason why the company just announced a change in leadership yesterday. It also may have the current CEO of General Electric (GE) looking over his shoulder a little bit more than usual today. There have already been calls for change at GE as its stock price is down close to 12% over the last 15 years, but F’s move yesterday may only increase the chatter. Finally, another notable name is Advanced Micro (AMD). Even as the stock has been one of the S&P 500’s top performers over the last two years, it is still down over 6% since the NFLX IPO in 2002.
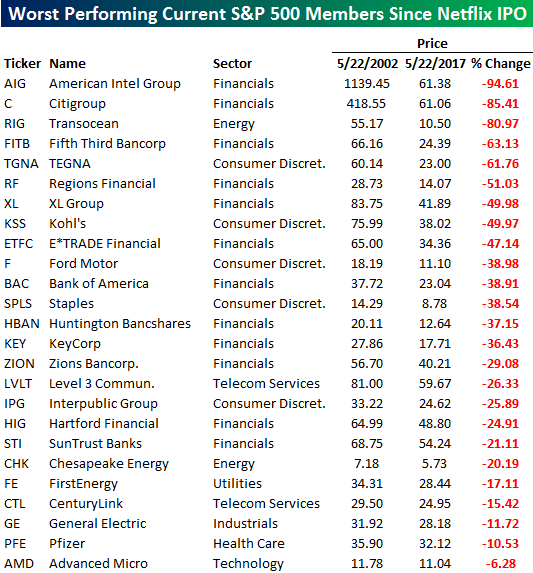
Chart of the Day: S&P 500 Sector Weightings
ETF Trends: US Indices & Styles – 5/23/17
Oil-related ETFs continue to outperform as the market evaluates this week’s OPEC meeting (discussed in The Morning Lineup today), with duration also outperforming as well with EDV, VNQ, and TLT on the best performers list. Brazil is still down the most over the last five days though EWZ is up over 6.5% from its May 18 closing low. Banks continue to underperform along with biotech, microcaps, and some growth ETFs.
Bespoke provides Bespoke Premium and Bespoke Institutional members with a daily ETF Trends report that highlights proprietary trend and timing scores for more than 200 widely followed ETFs across all asset classes. If you’re an ETF investor, this daily report is perfect. Sign up below to access today’s ETF Trends report.
See Bespoke’s full daily ETF Trends report by starting a no-obligation free trial to our premium research. Click here to sign up with just your name and email address.
Bespoke Stock Scores: 5/23/17
The Closer — Oh REERly, De-FANGing The Market, And Operating Surpluses — 5/22/17
Log-in here if you’re a member with access to the Closer.
Looking for deeper insight on global markets and economics? In tonight’s Closer sent to Bespoke Institutional clients, we take a look at currency strength per BIS real effective exchange rates, analyze the impact of the FANG stocks on overall market performance, and review which industries are generating the highest per-employee profit.
The Closer is one of our most popular reports, and you can sign up for a free trial below to see it!
The Closer is one of our most popular reports, and you can see it and everything else Bespoke publishes by starting a no-obligation 14-day free trial to our research!