ETF Trends: International – 5/26/17
With OPEC’s deal to extend production cuts by 9 months not impressing the oil market, Energy-related equities were the worst performers on the week; 6 of the 7 worst performers were related to equities. GBP, broad commodity indices, and gold miners also declined. On the winning side of the slate over the last 5 days were Transports, Utilities, a smattering of EMs, Utilities, and momentum stocks.

Bespoke provides Bespoke Premium and Bespoke Institutional members with a daily ETF Trends report that highlights proprietary trend and timing scores for more than 200 widely followed ETFs across all asset classes. If you’re an ETF investor, this daily report is perfect. Sign up below to access today’s ETF Trends report.
See Bespoke’s full daily ETF Trends report by starting a no-obligation free trial to our premium research. Click here to sign up with just your name and email address.
S&P 500 Quick View Chart Book: 5/26/17
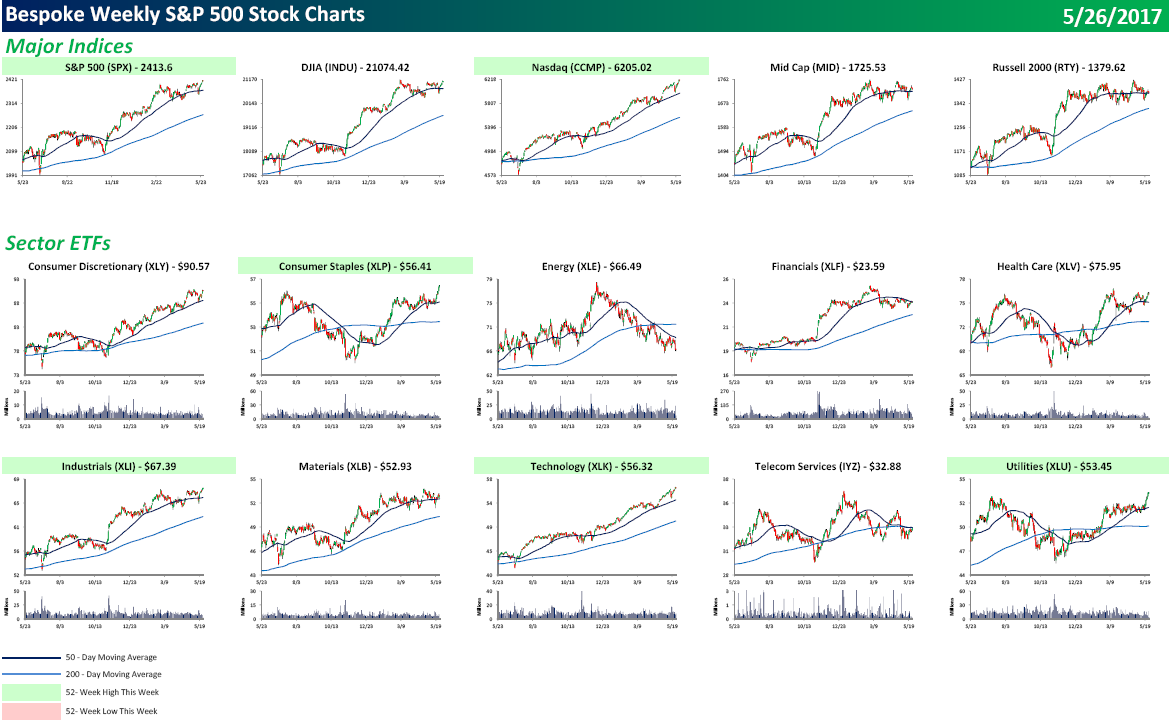
Each weekend as part of our Bespoke Premium and Institutional research service, clients receive our S&P 500 Quick-View Chart Book, which includes one-year price charts of every stock in the S&P 500. You can literally scan through this report in a matter of minutes or hours, but either way, you will come out ahead knowing which stocks, or groups of stocks, are leading and lagging the market. The report is a great resource for both traders and investors alike. Below, we show the front page of this week’s report which contains price charts of the major averages and ten major sectors.
To see this week’s entire S&P 500 Chart Book, sign up for a 14-day free trial to our Bespoke Premium research service.
Shake “Shorts”
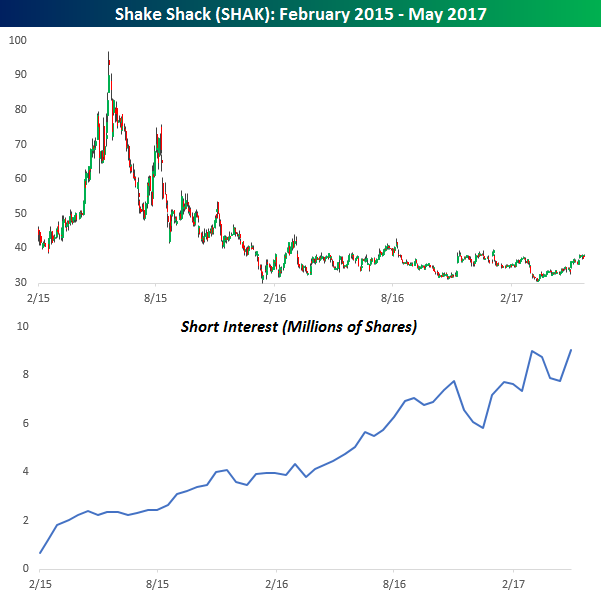
In a post earlier today on the US stocks with the highest levels of short interest, we highlighted the fact that former IPO high-flier Shake Shack (SHAK) currently has the highest level of short interest as a percentage of float. Shake Shack hasn’t been a public company very long, but it has already had quite a ride. After pricing at $21 at the end of January 2015, SHAK closed on its first day of trading at $45.9 for a one-day gain of 118.5%. SHAK wasn’t done there, though. After that first day gain, the stock kept rallying reaching a peak of $96 and change in May 2015. That’s where SHAK ran out of gas, though.
Since that May 2015 high, shares of SHAK have steadily drifted lower dropping to as low as $30 in early 2016. Ever since then, the stock has essentially been rangebound, trading between the low $30s and $40 per share. Given its valuation at the time of the IPO, it wasn’t a surprise to see negative bets against SHAK increase. Once the stock peaked, short interest continued to rise. It reached as high as 4 million shares at the stock’s lows in early 2016. What is interesting to note, however, is that since its lows in early 2016, the pace of negative bets has accelerated to the upside, with short interest levels increasing by 132% to its current level of 9 million shares, or 49% of the stock’s float. Clearly, investors are anticipating that once the stock breaks out of the sideways range it’s in, the next leg will be lower. Whether they are right is an entirely different question.Start a two-week free trial to Bespoke Institutional to see our complete semi-monthly look at short interest trends across the market.
The Three Horse Race to $1,000
While everyone out there seems to be focusing on the race between Alphabet (GOOGL) and Amazon.com (AMZN) over who will be the first to break the $1,000 barrier, there’s also another stock out there that’s on the cusp of crossing $1,000 for the first time. That stock is Markel (MKL), which is probably a name you have never heard of. With a market cap of just under $14 billion, MKL is not a behemoth like AMZN or GOOGL, but it’s still not small. MKL is actually an insurance company that is often referred to as a “baby Berkshire” as it has a large insurance underwriting business as well as a portfolio of equities that the company holds. As shown in the chart below, MKL is just as close to breaking $1,000 as AMZN and GOOGL.
Start a two-week free trial to Bespoke Institutional for access to our weekly Bespoke Report newsletter that’s released after the close every Friday.

While it is always dangerous to count your chickens before they’re hatched (see our post on the DJIA’s attempt to break 1,000 that spanned multiple decades), if one, two, or all of the stocks listed above do manage to break the $1,000 level, they will join a very exclusive club. As shown in the table below, there are currently just four stocks listed on US exchanges trading above $1,000/share with market caps of more than $500 mln that trade more than 250 shares per day. Those four stocks are Berkshire Hathaway (BRK/a), Seaboard (SEB), NVR, and Priceline (PCLN). What distinguishes AMZN and GOOGL from the others, though, is their liquidity. With average daily volumes of more than 1.5 million shares per day, the average daily dollar volume of these two stocks is well in excess of any other stock in the group.

S&P 1500 Most Heavily Shorted Stocks
Short interest figures for the middle of May were released after the close on Wednesday, and below we wanted to provide our updated list of the most heavily shorted stocks in the S&P 1500. The table below lists the 20 stocks in the S&P 1500 that have more than one-third of their free-floating shares sold short as of the middle of May. For each stock, we have also included its performance so far in the month of May. First, in terms of performance, the most heavily shorted stocks are underperforming the broader market. On an average basis, things don’t look that bad as the 20 stocks listed are up 0.63% compared to a gain of 1.11% for the S&P 1500. This average, however, is being skewed by some big gains in stocks like World Acceptance (WRLD), which is up over 50%, and Applied Optoelectronics (AAOI), which is up 40%. On a median basis, these 20 stocks are actually down more than 5%. Breadth among the most heavily shorted stocks further highlights the underlying weakness as just eight of the twenty names are positive for the month of May.
Looking at the list of individual names, a lot of them are probably unfamiliar to most people. One of the most notable names, however, is right at the top of the list as Shake Shack (SHAK) is the most heavily shorted stock in the S&P 1500 with just under half of its float sold short. People may love the burgers, fries, and shakes, but the stock is the most hated on the Street. Other notable names on the most shorted list include RH, Avis (CAR), JC Penney (JCP), Stamps.com (STMP), and Big Lots (BIG).
Start a two-week free trial to Bespoke Institutional to see our complete semi-monthly look at short interest trends across the market.

The Closer — Charting Comfort — 5/25/17
Log-in here if you’re a member with access to the Closer.
Looking for deeper insight on global markets and economics? In tonight’s Closer sent to Bespoke Institutional clients, we update tracking of weekly Bloomberg Consumer Comfort data, also charting up the US dollar and a couple of interesting setups in S&P 500 sectors.

The Closer is one of our most popular reports, and you can sign up for a free trial below to see it!
The Closer is one of our most popular reports, and you can see it and everything else Bespoke publishes by starting a no-obligation 14-day free trial to our research!
Alphabet and Amazon Bring Back Ghosts of 1,000s Past
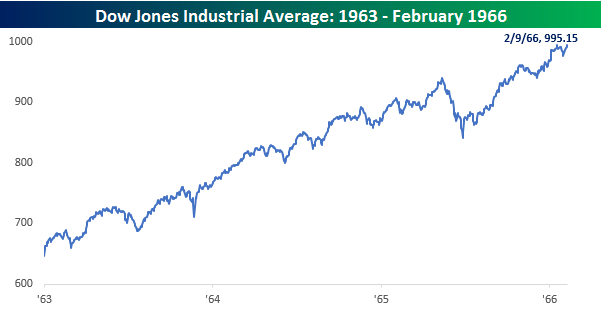
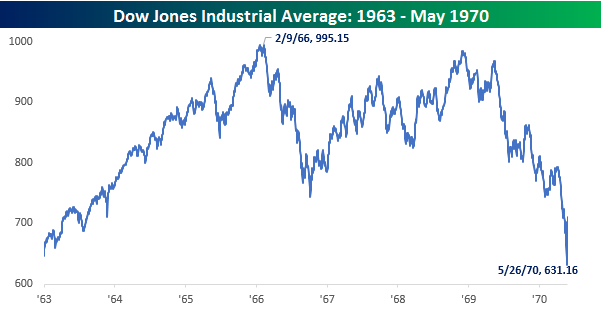
With Alphabet (GOOGL) and Amazon (AMZN) racing tick for tick towards the $1,000/share level but coming up just shy today, we just can’t help but be reminded of another run towards the 1,000 milestone 51 years ago. For the sake of the two stocks and the overall market, though, we hope that this time around, the $1,000 level isn’t nearly as tough a nut to crack. The battle for 1,000 we are talking about from 51 years ago was the Dow Jones Industrial Average. Back in 1966, after a rally of nearly 20% off of its June 1965 lows, the DJIA was knocking on the door of 1,000 but came up just shy of the mark, closing at 995.15 on 2/9/66. While the DJIA didn’t cross 1,000 on February 9th, we can’t help but think that most people felt it was just a matter of time before the 1,000 level was breached.
Start a two-week free trial to Bespoke Institutional to see our most actionable investment research.
Technically, “just a matter of time” was absolutely right, but we doubt anybody expected how long it would be. Not only did the DJIA not cross 1,000 in February of 1966, but it didn’t do so in March or April either. For that matter, it didn’t even crack 1,000 in all of 1966. It didn’t cross 1,000 in 1967 either. 1968? No. 1969? Nope. 1970? Wrong again. Actually, in May 1970 the DJIA wasn’t even in the 900s, but instead it was trading as low as 631.16 on 5/26/70.
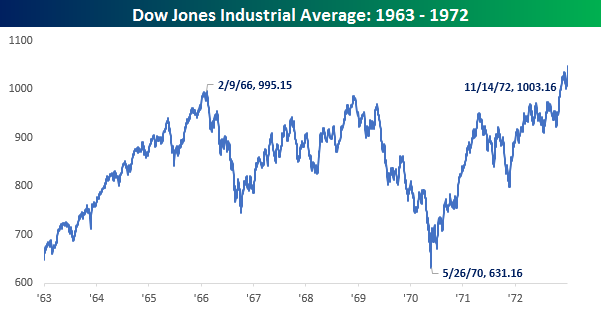
So when did the DJIA finally cross 1,000 on a closing basis? That didn’t happen until November 1972, a full six and a half years after it first tested 1,000. Just because Alphabet and Amazon didn’t do it today, let’s not get greedy. Hopefully, we won’t be waiting until 2022!
Five Largest Stocks Account For Nearly Half Of 2017’s Gains
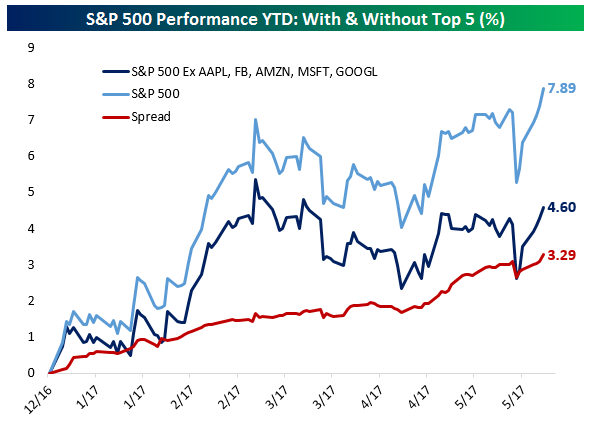
The market has seemed pretty top-heavy lately. We think the concerns around weak breadth have been a little bit overstated, though, as we mentioned in our Chart of the Day yesterday. But it’s still worth asking the question: how much of the market’s gain is attributable to the largest stocks? Below we show three series. The light blue line is returns for the S&P 500 YTD. In the dark blue line, we strip out the performance contribution of the five largest stocks in the S&P 500: Apple (AAPL), Facebook (FB), Amazon (AMZN), Microsoft (MSFT), and Alphabet (GOOGL). As shown, while the overall index is up almost 8% so far in 2017, it’s up only 4.6% if you strip out the five largest stocks. In the red series below we show the spread between the two, in other words, the cumulative performance contribution from those 5 stocks. At the start of the year, these five stocks accounted for 11.6% of the index’s market cap, so you’d expect a non-trivial percentage of gains to come from them. That share stands at about 13.7% today. Generating nearly half of the index’s gains with less than 15% of its market cap is an out-sized contribution and shows just how painful it can be in terms of relative performance if you’ve been underweight these mega-Tech behemoths.
Start a two-week free trial to Bespoke Institutional to see our most actionable investment research.
Bespoke’s Sector Snapshot — 5/25/17
We’ve just released our weekly Sector Snapshot report (see a sample here) for Bespoke Premium and Bespoke Institutional members. Please log-in here to view the report if you’re already a member. If you’re not yet a subscriber and would like to see the report, please start a 14-day trial to Bespoke Premium now.
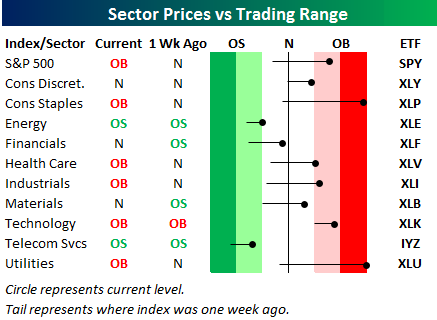
Below is one of the many charts included in this week’s Sector Snapshot, which highlights our trading range screen for the S&P 500 and ten sectors. The black vertical “N” line represents each sector’s 50-day moving average, while moves into the red or green zones are considered “overbought” or “oversold.” As you can see, two defensive sectors — Utilities and Consumer Staples — are the most overbought areas of the market right now. Bulls would rather see cyclical sectors leading the way when the S&P 500 is making new all-time highs as it is now.
To see our full Sector Snapshot with additional commentary plus six pages of charts that include analysis of valuations, breadth, technicals, and relative strength, start a 14-day free trial to our Bespoke Premium package now. Here’s a breakdown of the products you’ll receive.