We’ve just released our weekly Sector Snapshot report (see a sample here) for Bespoke Premium and Bespoke Institutional members. Please log-in here to view the report if you’re already a member. If you’re not yet a subscriber and would like to see the report, please start a 14-day trial to Bespoke Premium now.
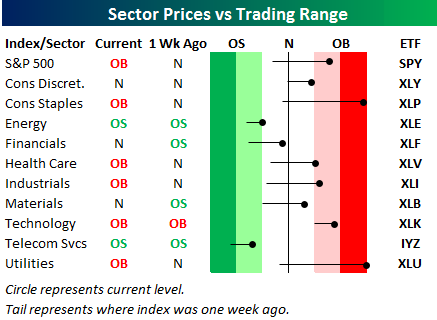
Below is one of the many charts included in this week’s Sector Snapshot, which highlights our trading range screen for the S&P 500 and ten sectors. The black vertical “N” line represents each sector’s 50-day moving average, while moves into the red or green zones are considered “overbought” or “oversold.” As you can see, two defensive sectors — Utilities and Consumer Staples — are the most overbought areas of the market right now. Bulls would rather see cyclical sectors leading the way when the S&P 500 is making new all-time highs as it is now.
To see our full Sector Snapshot with additional commentary plus six pages of charts that include analysis of valuations, breadth, technicals, and relative strength, start a 14-day free trial to our Bespoke Premium package now. Here’s a breakdown of the products you’ll receive.