The Closer — Gearing Down, Global & Domestic — 6/1/17
Log-in here if you’re a member with access to the Closer.
Looking for deeper insight on global markets and economics? In tonight’s Closer sent to Bespoke Institutional clients, we review global manufacturing PMIs, US auto sales, Brazilian growth, and Mexican IMEF PMIs released today.

The Closer is one of our most popular reports, and you can sign up for a free trial below to see it!
The Closer is one of our most popular reports, and you can see it and everything else Bespoke publishes by starting a no-obligation 14-day free trial to our research!
Bespoke Model Portfolio: WYNNing!
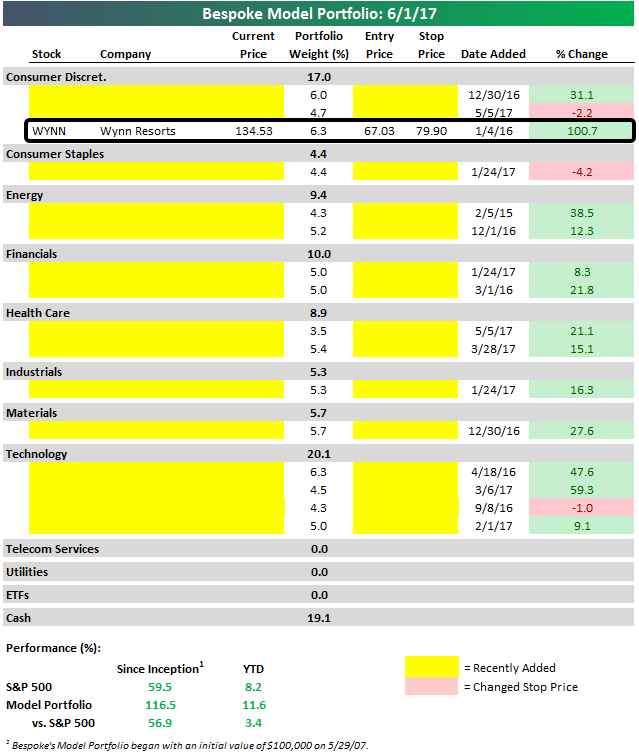
In early 2014, luxury casino company Wynn Resorts (WYNN) traded up near $250/share, but by early 2016 the stock had fallen more than 75% to trade as low as $57.74. When the stock dipped into the $60s, founder and CEO Steve Wynn began buying up a massive amount of shares. Between December 2015 and January 2016, Wynn purchased roughly $95 million worth of his company’s shares for an average price of $60.70. In less than a year and a half, Wynn has turned that $95 million purchase into $212 million as shares have jumped 120% to $134.
In early 2016, Bespoke also thought WYNN shares looked attractive. On January 4th, 2016, we added the name to our Bespoke Model Portfolio at $67.03. That trade is up over 100% as of today.
The Bespoke Model Portfolio is included with all three of our research packages for investors, and it’s a portfolio of our best growth stock ideas. Since inception in May 2007, the portfolio is up 116% versus a gain of 59.5% for the S&P 500. (As always, past performance is not a guarantee of future results.) Below is a snapshot of the portfolio as it’s presented to our members, but only the WYNN position is shown. We’ve redacted the remaining holdings — you have to be a member to see them! Start a 14-day free trial to Bespoke Premium to become a member and see the Bespoke Model Portfolio now. You’ll also get a 20% lifetime discount when you sign up today.
Bespoke’s Sector Snapshot — 6/1/17
We’ve just released our weekly Sector Snapshot report (see a sample here) for Bespoke Premium and Bespoke Institutional members. Please log-in here to view the report if you’re already a member. If you’re not yet a subscriber and would like to see the report, please start a 14-day trial to Bespoke Premium now.
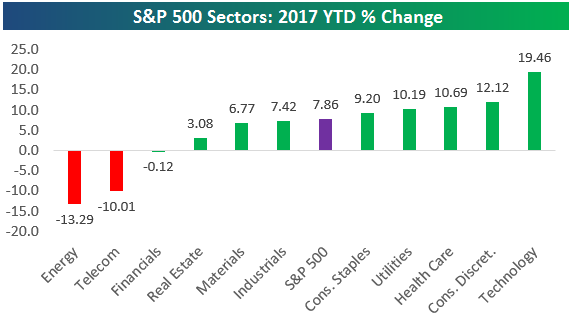
Below is one of the many charts included in this week’s Sector Snapshot, which simply highlights the year-to-date performance of the S&P 500 and its eleven major sectors. As shown, Technology is lapping the field with a gain of 19.46%. Consumer Discretionary, Health Care, and Utilities are the remaining sectors that are up 10%+, while both Energy and Telecom are down more than 10%.
To see our full Sector Snapshot with additional commentary plus six pages of charts that include analysis of valuations, breadth, technicals, and relative strength, start a 14-day free trial to our Bespoke Premium package now. Here’s a breakdown of the products you’ll receive.
ISM Manufacturing Stabilizes
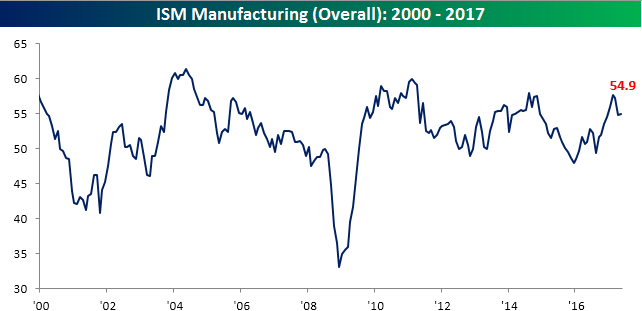
After two straight months of declines raised some serious questions about the post-election rebound in the manufacturing sector, the May ISM Manufacturing report provided a little comfort. While economists were forecasting a slight decline to 54.7 in the headline index, the actual reading showed a modest increase, rising from 54.8 to 54.9.
Start a two-week free trial to Bespoke Institutional today.
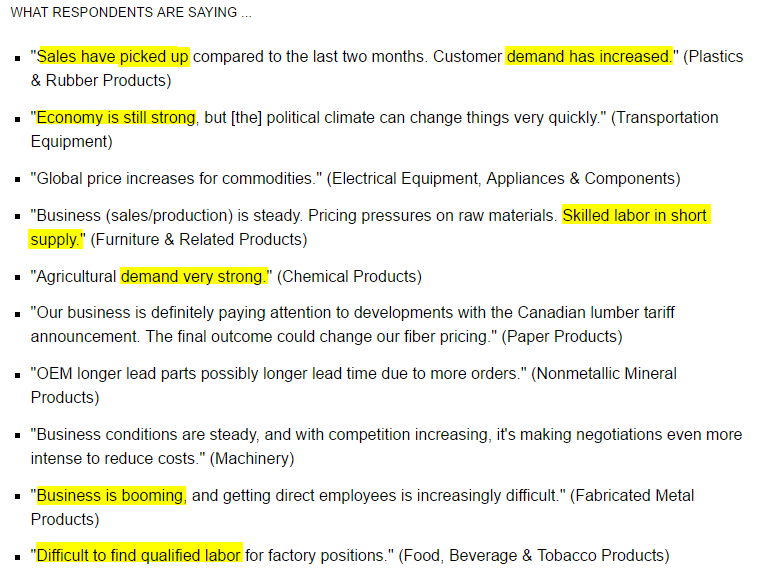
Of the 18 industries surveyed in May, just two reported a decline in business relative to April, and both of those are associated with the apparel industry (Apparel, Leather & Allied Products; and Textile Mills). As far as the commentary was concerned, once again it was positive this month. As shown in the highlights below, two themes that stand out are that business remains solid and labor markets are tight.
Breaking out this month’s report by each of its components, the table below shows the m/m and y/y changes in each component. Despite the fact that the headline index increase versus February, breadth in this month’s report was skewed to the downside with six components declining and just four increasing. The biggest increase this month was in Customer Inventories, while Prices Paid saw the largest decline and its largest m/m decline since November 2014. The decline in prices was also evident in the fact that the net number of commodities rising in price (8) was the lowest since December.

the Bespoke 50 — 6/1/17
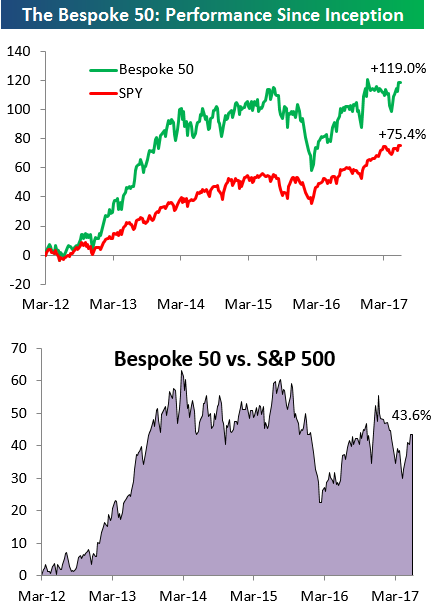
Every Thursday, Bespoke publishes its “Bespoke 50” list of top growth stocks in the Russell 3,000. Our “Bespoke 50” portfolio is made up of the 50 stocks that fit a proprietary growth screen that we created a number of years ago. Since inception in early 2012, the “Bespoke 50” has beaten the S&P 500 by 43.6 percentage points. Through today, the “Bespoke 50” is up 119.0% since inception versus the S&P 500’s gain of 75.4%. Always remember, though, that past performance is no guarantee of future returns.
To view our “Bespoke 50” list of top growth stocks, sign up for Bespoke Premium ($99/month) at this checkout page and get your first month free. This is a great deal!
Bespoke CNBC Appearance (5/31/17)
Bespoke co-founder Paul Hickey appeared on CNBC’s Closing Bell on 5/31 to discuss markets and debunk the argument that the market’s gains this year are being driven solely by the largest handful of stocks in the index. To view the segment, click on the image below.

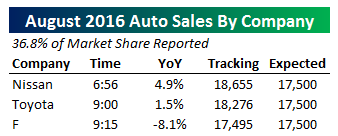
Auto Sales Tracking 4th Consecutive Miss In May
Update 1 2:03 PM: We’ve updated our tracker with early afternoon reports from Porsche, Subaru, Kia, and Mitsubishi, as well as adding a couple of reporting OEMs we had missed this morning and the results are not positive for our tracker. With 95% of the market reported (only Mercedes and BMW missing as of this writing), we tally an auto sales pace of 16.55mm SAAR, even worse than the miss indicated in our original post this morning. 16.55mm SAAR would be above March’s weak 16.52mm SAAR print (final BEA numbers), but below every other month since February of 2015. Hyundai, Mazda, and Kia, which had held up well in recent months as larger manufacturers lagged, delivered very weak numbers relative to the industry as a whole.
With the major auto original equipment manufacturers (OEMs) reported as of this writing, 81.1% of US auto sales in May have been announced. Based on what’s out currently, auto sales are highly likely to miss again in the month of May, which would be the 4th consecutive miss. Analysts were expecting a sales pace of 16.9mm SAAR, but reports from Ford, GM, and Fiat-Chrysler put our running tracker of sales well below that level. Currently, as of VW’s report we are tracking a sales pace of about 16.64mm SAAR. That figure could improve as smaller manufacturers report this afternoon but it’s not likely to clear the hurdle of analysts’ estimates based on how many OEMs have reported so far.

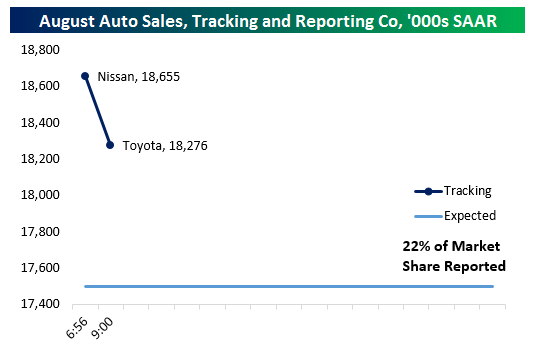
Chart of the Day: Ford Truck Sales Surge In May
Winners Remain Winners, Losers Remain Losers
The average stock in the S&P 500 was up less than 1% in the month of May, but there were obvious winners and losers. Basically, the stocks that had the most upside momentum coming into the month continued to post nice gains, while the stocks with the most downside momentum continued to post losses.
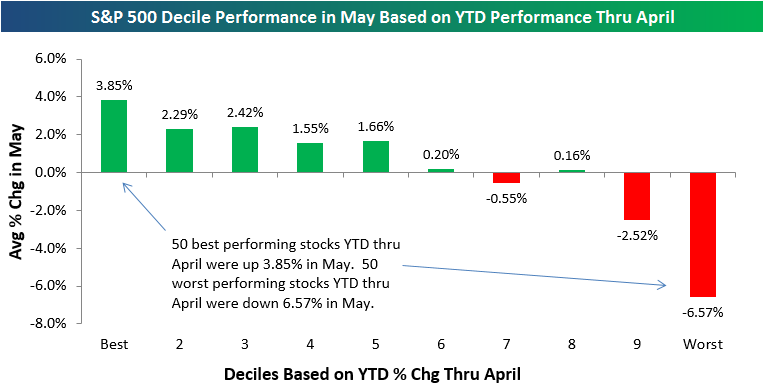
We can highlight this trend using our decile analysis of the S&P 500, where we break the index into deciles (10 groups of 50 stocks each) based on YTD return through April. Decile 1 contains the 50 best performing stocks YTD through April, decile 2 contains the next best 50, and so on and so forth until you get to decile 10, which contains the 50 worst performing stocks YTD through April.
As shown in the chart below, the 50 best performing S&P 500 stocks through April were up an average of 3.85% in May. The next best two deciles both averaged gains of more than 2.25%. As you extend out towards decile 10, performance in May gets worse. Stocks in decile 9 were down an average of 2.52% in May, while stocks in decile 10 — the 50 worst stocks YTD through April — were down an average of 6.57% in May. That’s extremely poor performance given that the broad market was higher during the month.
Will we see some mean reversion in June or will the “trend-is-your-friend” trade continue?
Bespoke Consumer Pulse Report — May 2017
Bespoke’s Consumer Pulse Report is an analysis of a huge consumer survey that we run each month. Our goal with this survey is to track trends across the economic and financial landscape in the US. Using the results from our proprietary monthly survey, we dissect and analyze all of the data and publish the Consumer Pulse Report, which we sell access to on a subscription basis. Sign up for a 30-day free trial to our Bespoke Consumer Pulse subscription service here. With a trial, you’ll get coverage of consumer electronics, social media, streaming media, retail, autos, and much more. The report also has numerous proprietary US economic data points that are extremely timely and useful for investors.
