Jobless Claims Ever Slightly Higher Than Expected
Jobless claims for this week came in higher than expected, but the margin was as small as it could possibly be. While economists were looking for claims to come in at a level of 240K, the actual reading came in at 241K. There wasn’t much that really stuck out in this week’s report that was new relative to prior weeks, just that claims have now been below 300K for 120 straight weeks and below 250K for the third straight week. We may have become numb to it with week after week of low readings, but it’s still pretty extraordinary. In terms of the recent trends in claims, current levels are right near the low end of their recent downtrend range.
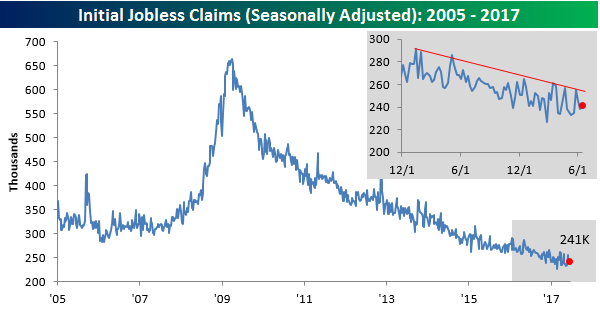
The four-week moving average ticked up 1.5K this week, rising to 244.75K. That’s now nearly 10K above the cycle low of 235.5K that we hit in mid-May.

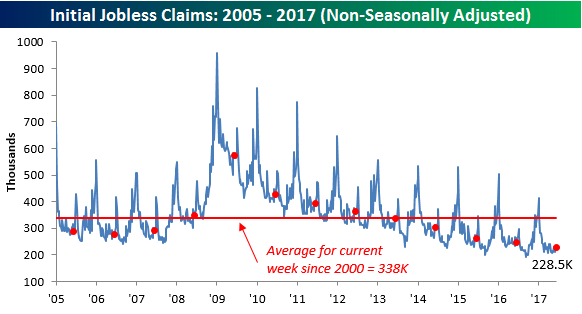
On a non-seasonally adjusted (NSA) basis, claims declined from 234.2K down to 228.5K. For the current week of the year, that is the lowest since 1973 and nearly 110K below the average of 337.9K since 2000.
Bespokecast Episode 13 — Louis Navellier — Now Available on iTunes, GooglePlay, Stitcher and More
 We’re happy to announce that the newest episode of Bespokecast is now available to the general public both here and via the various podcast platforms. Be sure to subscribe to Bespokecast on your preferred podcast app to gain access to our full collection of episodes. We’d also love for you to provide a review as well!
In our newest conversation on Bespokecast, we talk to Louis Navellier, the founder of Navellier & Associates. Louis has been writing about the stock market since the early 1980s, and his firm offers a range of services for clients including portfolio management, advisory, and mutual funds. Louis brings a unique and highly quantitative approach to investing, and has from the very start of his work on market efficiency and factors which drive outperformance. We discuss in depth his entry into the industry, the approach he uses in analyzing the markets, and his detailed views around ETFs and their impact on liquidity and volatility. Louis had a number of interesting perspectives on the relationship between yields and equity prices as well as monetary policy. We hope you enjoy the conversation!
Each new episode of our podcast features a special guest to talk markets with, and Bespoke subscribers receive access before it’s made available to the general public. If you’d like to try out a Bespoke subscription in order to gain access to these podcasts in advance, you can start a two-week free trial to our research platform. To listen to episode 13 or subscribe to the podcast via iTunes, GooglePlay, OvercastFM, or Stitcher, please click the button or links below.

The Closer — Credit Wider, Crude Lower — 6/21/17
Log-in here if you’re a member with access to the Closer.
Looking for deeper insight on global markets and economics? In tonight’s Closer sent to Bespoke Institutional clients, we review weekly EIA data on petroleum inventories and chart spread on credit default swaps.

The Closer is one of our most popular reports, and you can sign up for a free trial below to see it!
The Closer is one of our most popular reports, and you can see it and everything else Bespoke publishes by starting a no-obligation 14-day free trial to our research!
B.I.G. Tips – Trading Like It’s 1995
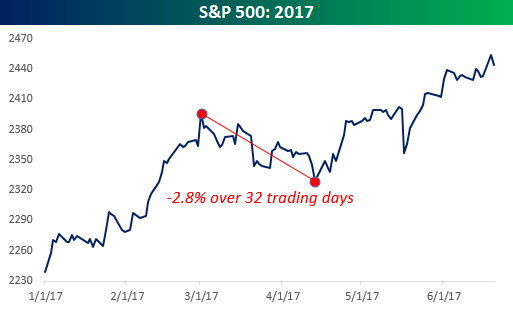
With the first half of 2017 nearly complete, investors really have gotten off easy in 2017. Inundated with headlines about scandals involving officials at all levels in Washington, stocks have seemingly done nothing but go up as the S&P 500 has 24 all-time closing highs since the year started. The worst sell-off the S&P 500 has seen from a closing basis this year was a 2.8% decline over 32 trading days from March 1st through April 13th. Maybe we’re getting old, but we can remember the days back in 2007 and 2008 when 2.8% declines were common in a single day. At one point over a 50-trading day period in 2008, the S&P 500 averaged an absolute daily change of 4.00%!
2017 has been so easy on the bulls, in fact, that there has only been one other year in the S&P 500’s history where it saw a smaller maximum drawdown in the first half fo the year. In a B.I.G. Tips report sent to our clients earlier today, we looked at prior years where the S&P 500 steadily rose in the first half of the year with little in the way of drawdowns along the way to see how equities performed in the second half. You’d be surprised at the results. For anyone interested in seeing this report, sign up for a monthly Bespoke Premium membership now!
Energy Says, “What Bull Market?”
Back in late December, the Energy sector was riding high on optimism of a Trump Presidency and the prospect of less regulation in the Energy sector. Six months, more supply, and -17% later, the sector, like WTI crude oil, is near bear market territory, in what has been an extreme period of underperformance. The chart below shows the rolling one-year performance spread between the S&P 500 Energy sector and the overall S&P 500. When the line is above zero it indicates that Energy is outperforming the S&P 500 while a negative reading indicates underperformance. In the last year alone, the Energy sector has underperformed the S&P 500 by more than 23 percentage points. While the margin of underperformance was a lot wider during the energy bust a couple of years back, since 1980 there have only been a handful of other periods where the margin of underperformance was this wide. More recently, since 2000, it has only happened twice.
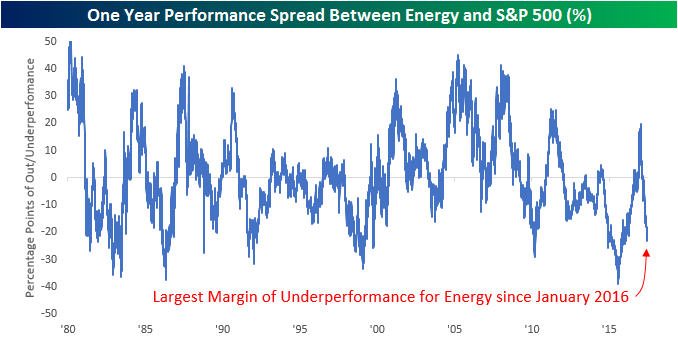
Chart of the Day: Late to the Party
Fixed Income Weekly – 6/21/17
Searching for ways to better understand the fixed income space or looking for actionable ideals in this asset class? Bespoke’s Fixed Income Weekly provides an update on rates and credit every Wednesday. We start off with a fresh piece of analysis driven by what’s in the headlines or driving the market in a given week. We then provide charts of how US Treasury futures and rates are trading, before moving on to a summary of recent fixed income ETF performance, short-term interest rates including money market funds, and a trade idea. We summarize changes and recent developments for a variety of yield curves (UST, bund, Eurodollar, US breakeven inflation and Bespoke’s Global Yield Curve) before finishing with a review of recent UST yield curve changes, spread changes for major credit products and international bonds, and 1 year return profiles for a cross section of the fixed income world.
In this week’s note, we observe the aggressive flattening of the US curve relative to the rest of the world, and its primacy as a driver of global curve flattening charted below.
Our Fixed Income Weekly helps investors stay on top of fixed income markets and gain new perspective on the developments in interest rates. You can sign up for a Bespoke research trial below to see this week’s report and everything else Bespoke publishes free for the next two weeks!
Click here to start your no-obligation free Bespoke research trial now!
ETF Trends: Fixed Income, Currencies, and Commodities – 6/21/17
The ratio of XBI (S&P Biotech, equal-weight) to XOP (S&P Oil & Gas Exploration & Production, equal-weight) hit a new all-time low today and that sums up the state of our ETF universe well. Biotech, Health Care, and Pharma are leading the charge, with bonds also performing well, while oil stocks, retail, and a smattering of EM underperform sharply.

Bespoke provides Bespoke Premium and Bespoke Institutional members with a daily ETF Trends report that highlights proprietary trend and timing scores for more than 200 widely followed ETFs across all asset classes. If you’re an ETF investor, this daily report is perfect. Sign up below to access today’s ETF Trends report.
See Bespoke’s full daily ETF Trends report by starting a no-obligation free trial to our premium research. Click here to sign up with just your name and email address.
The Closer — Canada Fights The Curve, US Current Account Update — 6/20/17
Log-in here if you’re a member with access to the Closer.
Looking for deeper insight on global markets and economics? In tonight’s Closer sent to Bespoke Institutional clients, we update our tracking model for Canadian GDP and evaluate the Canadian yield curve. We also recap quarterly current account balance data reported by the BEA today.
The Closer is one of our most popular reports, and you can sign up for a free trial below to see it!
The Closer is one of our most popular reports, and you can see it and everything else Bespoke publishes by starting a no-obligation 14-day free trial to our research!
Bespokecast — Episode 13 — Louis Navellier
In our newest conversation on Bespokecast, we talk to Louis Navellier, the founder of Navellier & Associates. Louis has been writing about the stock market since the early 1980s, and his firm offers a range of services for clients including portfolio management, advisory, and mutual funds. Louis brings a unique and highly quantitative approach to investing, and has from the very start of his work on market efficiency and factors which drive outperformance. We discuss in depth his entry into the industry, the approach he uses in analyzing the markets, and his detailed views around ETFs and their impact on liquidity and volatility. Louis had a number of interesting perspectives on the relationship between yields and equity prices as well as monetary policy. We hope you enjoy the conversation!
To access Episode 13 immediately, please start a 14-day free trial to Bespoke’s research product. If you’ve already signed up for a Bespoke free trial in the past, you can gain access by choosing a membership option at our products page. Here’s a look at past guests if you’re interested.