Bespoke Brunch Reads: 7/2/17
Welcome to Bespoke Brunch Reads — a linkfest of the favorite things we read over the past week. The links are mostly market related, but there are some other interesting subjects covered as well. We hope you enjoy the food for thought as a supplement to the research we provide you during the week.
See this week’s just-published Bespoke Report newsletter by starting a no-obligation two-week free trial to our premium research platform.
Investing
Just Like That, a Bad Year for Buybacks Becomes a Good One by Lu Wang (Bloomberg)
With the approval of capital return plans by the Fed this week, banks have boosted the annual buyback totals quite dramatically. [Link]
Ex-Bridgewater Quant Says Smart Beta ETFs Use Factors All Wrong by Dani Burger (Bloomberg)
It turns out that factor-based investing might work better as a way to find shorts. [Link]
Insurance Is the Hot New Way to Avoid Taxes by Sonali Basak and Tom Metcalf (Bloomberg)
Insurance products allow high net worth individuals to see capital compound within policies, untaxed, and disbursed to beneficiaries of the policyholder after they die. [Link]
Labor Markets
Want a $1 Million Paycheck? Skip College and Go Work in a Lumberyard by By Prashant Gopal and Matthew Townsend (Bloomberg)
The popular conception of high paying jobs: that they only come from a college degree and aren’t what you’d call blue collar. That’s not actually the case. [Link]
A Mystery Fed Candidate Won a Seat at the FOMC Table, Then Walked Away by Christopher Condon (Bloomberg)
Prior to the appointment of President Harker to his seat at the head of the Philadelphia Fed, another candidate was considered and even approved by the Board of Governors but turned down the spot. [Link]
Rural America
Rural Youth Chase Big-City Dreams by Dante Chinni (WSJ)
A fascinating accounting of population flows out of small towns and into areas hosting large colleges, then to cities…but not back to the rural counties where they grew up. [Link; paywall]
Social Science
Equity, efficiency and education spending in the United States by Nick Bunker (Washington Center for Equitable Growth)
A new study has shown no trade-offs between efficiency and equity in education spending, a remarkable finding that would be relatively unique in public policy. [Link]
Inequality
Counterintuitive problem: Everyone in a room keeps giving dollars to random others. You’ll never guess what happens next. (Decision Science News)
Random distribution of income does not lead to equality, but instead creates quite a bit of inequality, a counter-intuitive outcome. [Link]
People Differences vs. Place Differences: What Causes Social Mobility? by Robert VerBruggen (Institute for Family Studies)
One factor that can mitigate inequality is high social mobility: if there’s lots of inequality, it’s less damaging if people move up and down across the income spectrum. But social mobility is deeply tied to a number of factors, explored in this piece. [Link]
Seattle Minimum Wage
A ‘very credible’ new study on Seattle’s $15 minimum wage has bad news for liberals by Max Ehrenfreund (WSJ)
Seattle introduced a very large minimum wage hike a few years ago and we’re starting to get data on what it means. The first reaction was that the study showed very large effects (negative ones) on employment and hours. [Link; soft paywall]
The “high road” Seattle labor market and the effects of the minimum wage increase by Ben Zipperer and John Schmitt (Economic Policy Institute)
A contrary argument on reading too far into the findings of the Seattle minimum wage study. The piece lays out some good reasons to be skeptical about the findings. [Link]
The City Knew the Bad Minimum Wage Report Was Coming Out, So It Called Up Berkeley by Daniel Person (Seattle Weekly)
A sideshow to the academic debate about the Seattle study was what appeared to be manipulation by the Seattle Mayor’s office. It’s a bit complicated, but it’s worth reading as an example of how not to conduct oneself as an academic researcher. [Link]
Science Terrifying And Hilarious
Scientists can’t rule out collision with asteroid flying by Earth in 2029 by Mike Wehner (BGR)
99942 Apophis is bound for Earth, and while a collision isn’t forecast, at an estimated approach of less than 20,000 miles the 1200 foot diameter rock with an estimated yield on collision of more than 750 megatons would be a really bad day for the planet if it did end up hitting. [Link]
That Time the TSA Found a Scientist’s 3-D-Printed Mouse Penis by Ed Yong (The Atlantic)
A compilation of the hysterical travails of scientists trying to get through security with their panoply of paraphernalia. [Link]
This Week In The Valley
More Than 50% of Shoppers Turn First to Amazon in Product Search by Spencer Soper (Bloomberg)
Amazon is the first destination for more than half of consumers, a massive advantage for the e-commerce giant. [Link]
Waymo, Apple Deals Bolster Rental Firms for Ride-Sharing Age by David Welch and Alex Webb (Bloomberg)
Car rental giants Avis and Hertz have signed deals to manage (service and repair) the hardware that Apple and Alphabet Inc are using to help deploy autonomous vehicles. [Link; auto-playing video]
Not A Good Look
NYSE President Calls Short Sellers ‘Icky’ by Annie Massa (Bloomberg)
In a move jeered at by short-sellers across The Street, a New York Stock Exchange executive called short-selling un-American this week. [Link]
Phil’s Insider-Trading Escape by Jeffrey Toobin (Golfworld)
A long read on how Phil Mickelson managed to avoid insider trading charges. [Link]
Potpourri
Why my guitar gently weeps by Geoff Edgers (WaPo)
As young people explore other forms of music, and the venerable guitar hero fades into the past, there’s less interest in playing and owning high-end guitars. [Link; soft paywall]
Old Glories: A Salute to Antique U.S. Flags, and Where to Find One by Steve Garbarino (WSJ)
An oral history of antique flags, which can be both unique and expensive. [Link; paywall]
If Buddhist Monks Trained AI by Alexis C. Madrigal (The Atlantic)
How do Buddhist monks respond to the classic “Trolley” problem, a key philosophical and moral issue for designers of code that will run autonomous vehicles. [Link]
Have a great Sunday!
Biggest S&P 500 Winners and Losers of the First Half — 2017
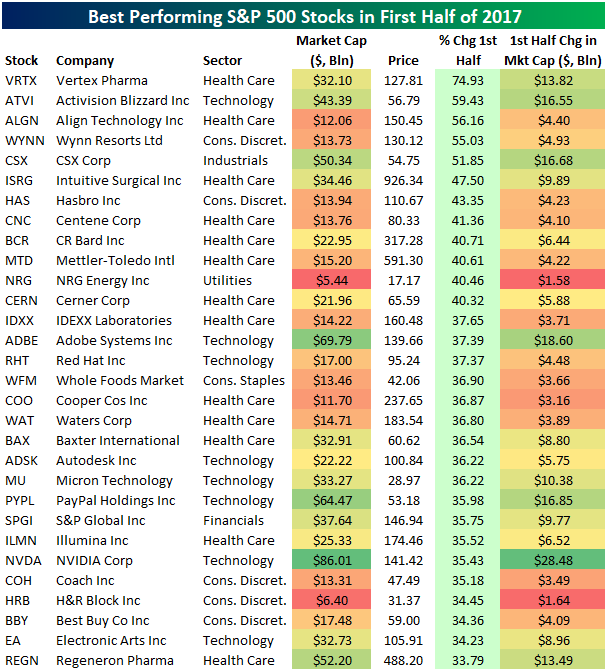
Below is a look at the best performing S&P 500 stocks in the first half of 2017. Each stock that made the cut gained more than 33%. At the top of the list is Vertex Pharma (VRTX), which gained 74.93%. Activision Blizzard (ATVI) ranks second at +59.43%, followed by Align Technology (ALGN) at +56.16%. Wynn Resorts (WYNN) and CSX round out the top five.
Other notables on the list of first half winners include Intuitive Surgical (ISRG), Hasbro (HAS), Adobe (ADBE), NVIDIA (NVDA), Coach (COH), and Best Buy (BBY).
Want to see more analysis like this? Click here to start a no-obligation two-week free trial to our premium research platform.
We’ve also created a table to show the biggest gainers in market cap in the first half of 2017. As shown, Apple (AAPL) gained the most at +$133.31 billion, followed by Amazon.com (AMZN) at +$106.37 billion and Facebook (FB) at +$105.20 billion. Alphabet (GOOGL) ranked 4th at +96.7 billion. In fifth place, but well behind the top four was Oracle (ORCL) with a gain of $49.68 billion. Oracle’s big gain is impressive, however, but it was overshadowed by all the attention on the “FAANG” stocks in the first half.

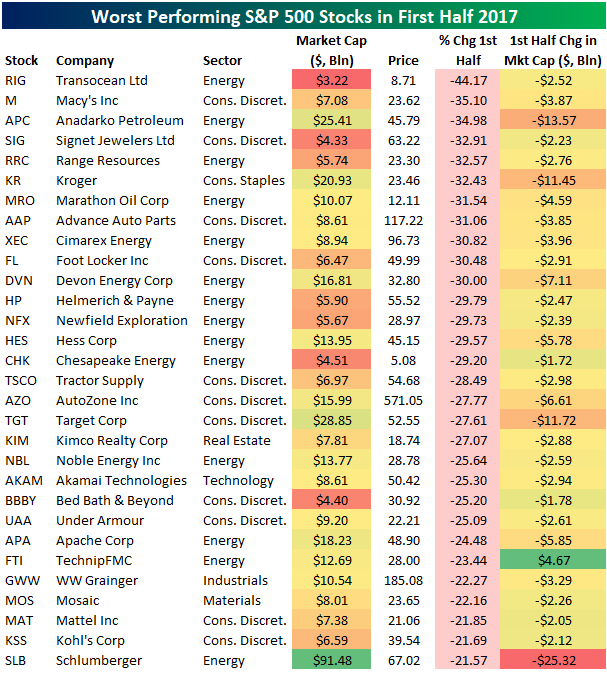
Of course, you can’t just highlight the winners all the time. Below is a list of the worst performing S&P 500 stocks in the first half of 2017. Transocean (RIG) tops the list with a drop of 44.17% in the first half. Macy’s (M) ranks second worst at -35.10%, followed by Anadarko Petroleum (APC), Signet Jewelers (SIG), and Range Resources (RRC). Other notables on the list include Kroger (KR), Foot Locker (FL), AutoZone (AZO), Bed Bath & Beyond (BBBY), Under Armour (UAA), Target (TGT), and Kohl’s (KSS). In the case of Autozone (AZO), it seems to be picking up in the second half right where it left off in the first as it’s already down 10%!
Basically all of the weakness in the first half was in Energy or Retail.
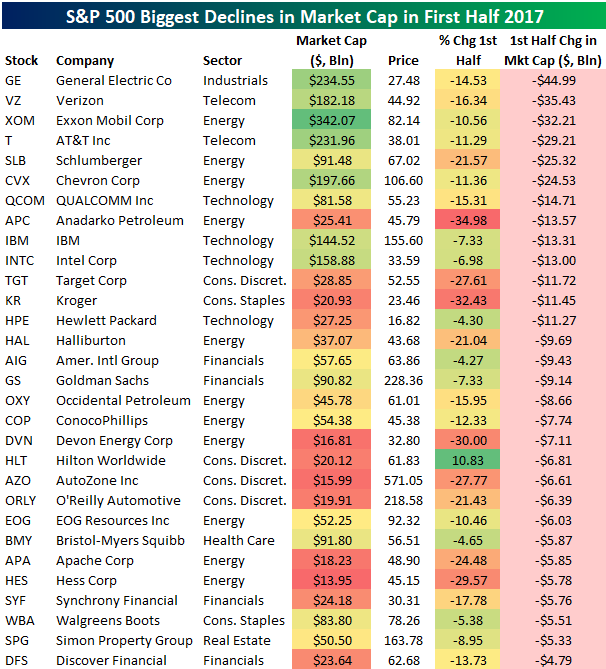
In terms of market cap, General Electric (GE) was the biggest loser in the first half of 2017. GE lost $44.99 billion in market cap, dropping its total market cap to $234.55 billion. Verizon (VZ) lost the second most at -$35.43 billion, followed by Exxon Mobil (XOM) at -$32.21 billion and AT&T (T) at -$29.21 billion.
The Bespoke Report — 6/30/17
The Closer 6/30/17 – End of Week Charts
Looking for deeper insight on global markets and economics? In tonight’s Closer sent to Bespoke clients, we recap weekly price action in major asset classes, update economic surprise index data for major economies, chart the weekly Commitment of Traders report from the CFTC, and provide our normal nightly update on ETF performance, volume and price movers, and the Bespoke Market Timing Model. This week, we’ve added a section that helps break down momentum in developed market foreign exchange crosses.

The Closer is one of our most popular reports, and you can sign up for a free trial below to see it!
Click here to start your no-obligation two-week free Bespoke research trial now!
S&P 500 Quickview Chartbook – 6/30/17
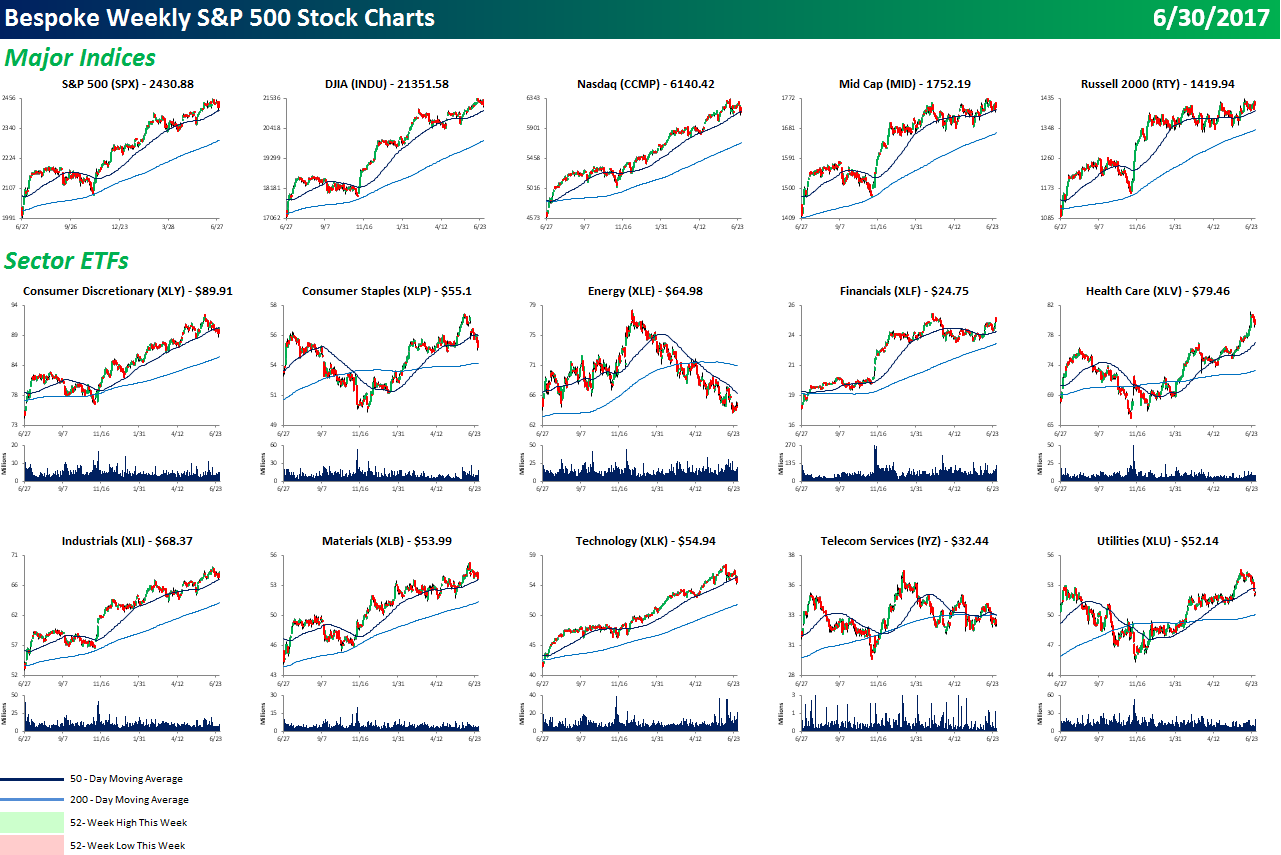
Each weekend as part of our Bespoke Premium and Institutional research service, clients receive our S&P 500 Quick-View Chart Book, which includes one-year price charts of every stock in the S&P 500. You can literally scan through this report in a matter of minutes or hours, but either way, you will come out ahead knowing which stocks, or groups of stocks, are leading and lagging the market. The report is a great resource for both traders and investors alike. Below, we show the front page of this week’s report which contains price charts of the major averages and ten major sectors.
To see this week’s entire S&P 500 Chart Book, sign up for a 14-day free trial to our Bespoke Premium research service.
ETF Trends: Hedge – 6/30/17
Steel continues its strong performance among the universe of ETFs that we track, up 6% on a 5 day rolling basis. Oil is making a nice recovery after appearing on our list of worst performers last week. Energy is also up almost 5%, most likely due to President Trump announcing his plan to achieve “energy dominance” in the coming years. On the losing side, Real Estate and Mining continue to struggle, while Biotech took a step backwards after good performance last week.

Bespoke provides Bespoke Premium and Bespoke Institutional members with a daily ETF Trends report that highlights proprietary trend and timing scores for more than 200 widely followed ETFs across all asset classes. If you’re an ETF investor, this daily report is perfect. Sign up below to access today’s ETF Trends report.
See Bespoke’s full daily ETF Trends report by starting a no-obligation free trial to our premium research. Click here to sign up with just your name and email address.
Bespoke CNBC Appearance (6/29/17)
Bespoke co-founder Paul Hickey appeared on CNBC’s Closing Bell with Kelly Evans, Mike Santoli, and Stephanie Link on 6/29 to discuss the market sell-off and the set up for the second half. To view the segment, please click on the image below.

July 4th Week Returns: Fireworks or a Flop?
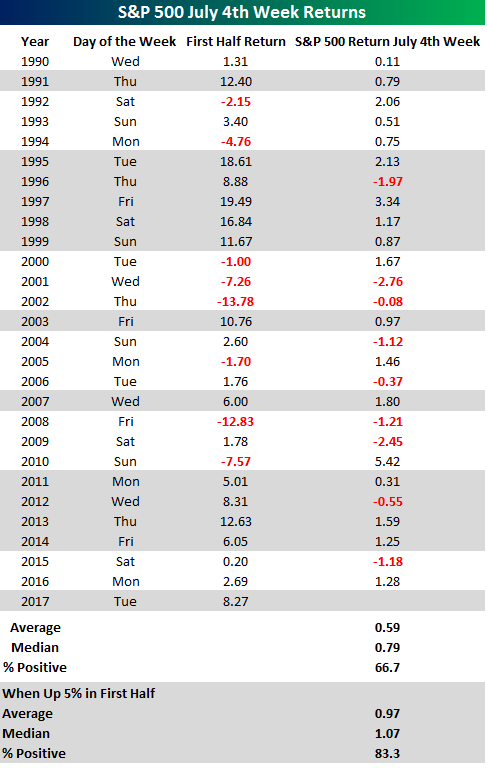
With July 4th coming around next Tuesday, we wanted to provide an update on market returns during the July 4th holiday week. Can we expect fireworks or a flop? The table below lists the S&P 500’s returns during the week of July 4th going back to 1990. For each year, we calculated the S&P 500’s return from the Friday before July 4th to the Friday after, and in those years where the 4th fell on a Friday, we calculated the return from the Friday before (6/27) through the Thursday before (7/3). As shown in the results, July 4th week has been a positive one for equity markets with the S&P 500 averaging a gain of 0.59% (median: +0.79%) and positive returns two-thirds of the time. The best July 4th week actually came back in 2010 when the S&P 500 was up over 5%. What was interesting about that week is that the strong performance came even as economic data during the week was skewed towards the negative side. Also, on the prior Friday, a well-known market strategist made a headline-grabbing call to sell stocks due to the worsening outlook for the US economy.
Given the S&P 500’s strong first half returns in 2017, we also looked at how the market performed in July 4th weeks that followed a strong first half. In the twelve prior years where the S&P 500 was up more than 5% in the first half of the year, July 4th week saw an average gain of 0.97% (median: 1.07%) with positive returns in all but two instances.
Want to see more analysis like this? Click here to start a no-obligation two-week free trial to our premium research platform.
The Closer — Nasty-daq, Twisted VIX, Growth Revised — 6/29/17
Log-in here if you’re a member with access to the Closer.
Looking for deeper insight on global markets and economics? In tonight’s Closer sent to Bespoke Institutional clients, we take a look at the technical picture for tech after big downdrafts today for large cap names in that sector. We also review today’s 3rd release of GDP for Q1.
The Closer is one of our most popular reports, and you can sign up for a free trial below to see it!
The Closer is one of our most popular reports, and you can see it and everything else Bespoke publishes by starting a no-obligation 14-day free trial to our research!
Bespoke’s Sector Snapshot — 6/29/17
We’ve just released our weekly Sector Snapshot report (see a sample here) for Bespoke Premium and Bespoke Institutional members. Please log-in here to view the report if you’re already a member. If you’re not yet a subscriber and would like to see the report, please start a 14-day trial to Bespoke Premium now.
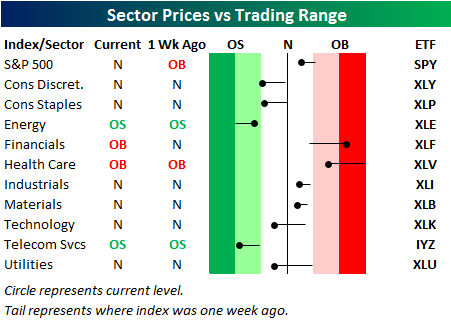
Below is one of the many charts included in this week’s Sector Snapshot, which highlights our trading range screen for the S&P 500 and ten sectors. For each sector, the dot represents where it’s currently trading, while the tail end represents where it was trading one week ago. The black vertical “N” line represents each sector’s 50-day moving average, and moves into the red or green zones are considered overbought or oversold.
As you can see, the S&P 500 has moved from overbought territory to neutral territory over the last week, and it has been led lower by Technology, Consumer Discretionary, Consumer Staples, and Utilities.
To see our full Sector Snapshot with additional commentary plus six pages of charts that include analysis of valuations, breadth, technicals, and relative strength, start a 14-day free trial to our Bespoke Premium package now. Here’s a breakdown of the products you’ll receive.