Largest 5-Week Decline in Crude Oil Inventories in Over Three Years
Crude oil inventories dropped more than expected this week, posting the sixth straight weekly decline and the 16th weekly decline in the last 18 weeks. According to the DoE, weekly inventories declined by 6.45 million barrels in the latest week compared to estimates for a decline of just 2.2 million barrels. Over the last five weeks now, crude oil inventories have declined by 27.5 million barrels, which is the largest five-week decline since the beginning of 2014. At current levels, crude oil stockpiles in the United States remain well above their historical averages of the last five years and going all the way back to 1983. In fact, relative to averages since 1983, crude oil stockpiles are more than 165 million barrels (40%) above average.
At current levels, crude oil stockpiles in the United States remain well above their historical averages of the last five years and going all the way back to 1983. In fact, relative to averages since 1983, crude oil stockpiles are more than 165 million barrels (40%) above average. What is notable about the recent decline in stockpiles is that following the last several weeks of declines, crude oil inventories are now below where they were at this time last year, and at the very least that’s a moral victory.

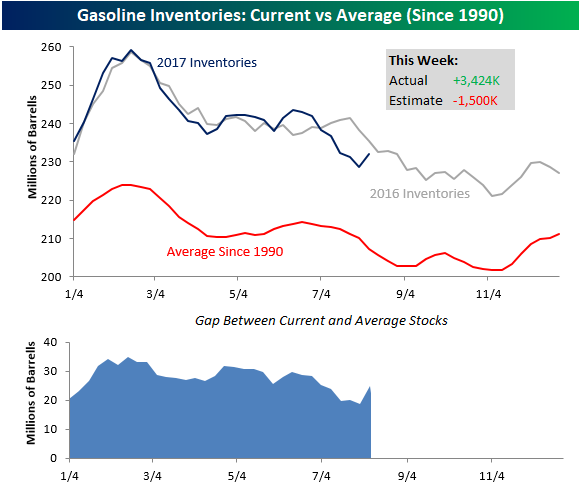
While oil inventories saw a much larger than expected decline this week, gasoline stockpiles unexpectedly increased. As shown in the chart below, gasoline inventories increased by 3.4 million barrels this week compared to estimates for a decline of 1.5 million barrels. With that increase, inventory levels are just below their levels from the same time last year, but still well above the historical average going back to 1990.
Gas Prices Rising as Summer Driving Season Winds Down
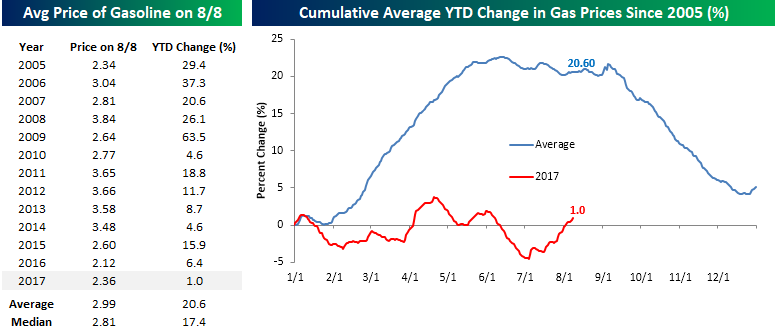
Labor Day is now less than a month away and with many schools around the country starting back to school in the next couple of weeks, the Summer driving season is starting to wind down. With that in mind, we wanted to take a look at where gas prices currently stand as well as how those prices compare to prior years. According to AAA, the current national average price of a gallon of gas is $2.36 per gallon. While that is up considerably from this point last year, there have only been two years (including 2016) where gas prices were lower at this time of year than they are now. The only other year was 2005 when the national average price was two cents less at $2.34. As shown in the left table below, with a YTD increase of 1.0%, there hasn’t been a single year since 2005 where prices saw a smaller YTD gain through August 8th.
The chart below to the right compares the performance of gas prices so far this year to a composite of its performance in all years since 2005. The pattern for gas prices so far in 2016 looks nothing like the ‘typical’ pattern that we have seen in prior years. Whereas prices are typically up over 20% YTD at this time of year, this year they are barely breaking even. The main reason for this year’s shortfall is that prices never saw the seasonal increase in the Spring that is typical. Looking ahead, prices typically decline sharply after Labor Day, but since prices never ran up in the Spring, perhaps they won’t see the typical decline in the fall. Regardless of what happens going forward, the fact that prices have essentially seen no gains YTD has created a small windfall for consumers.
Finally, the chart below shows the y/y change in average gasoline prices going back to 2006. With an 11% y/y gain relative to this time last year, the rate of change is positive which is a change from most other periods in the last two to three years, but it is well off the rapid pace of increase we saw earlier this year when the y/y changes were working off of a very low base from the 2016 lows.

Bespoke’s Post-Market Closer – Getting the Story Straight: Breadth and Indexing – 8/8/17
Log-in here if you’re a member with access to the Closer.
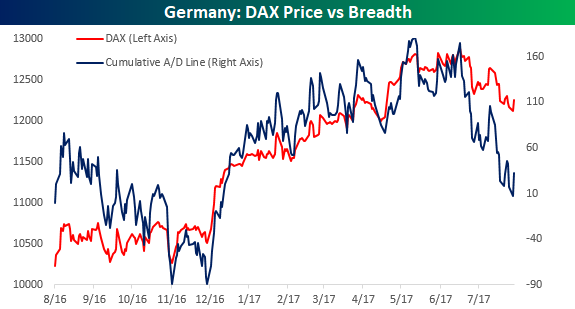
Looking for deeper insight on global markets and economics? In tonight’s Closer sent to Bespoke Institutional clients, we try to set the story straight on breadth and the impact of indexing on the market. With all the talk about narrow rallies, if there is one index people should focus on it’s Germany, where breadth has been deteriorating at a much faster rate than price.
The Closer is one of our most popular reports, and you can sign up for a free trial below to see it!
See today’s post-market Closer and everything else Bespoke publishes by starting a no-obligation 14-day free trial to our research platform!
Chart of the Day: Chinese Tech One-Ups FANG
ETF Trends: Hedge – 8/8/17
What a Difference Less Than Three Months Can Make
Less than three months ago back in mid-May, emerging market stocks led by Brazil went into a tailspin on reports that Brazilian President Michel Temer was under investigation in connection with a corruption scandal. The news sent the Brazilian Benchmark Ibovespa down nearly 9% in a single day in a move that was more reminiscent of the 1990s when emerging markets were extremely volatile rather than the current lower volatility era for the region. What a difference ten weeks can make though. While the Ibovespa didn’t exactly experience a v-shape bounce, the rebound has been swift. In the last two days, the index has rallied more than 2% and is back within spitting distance of the levels it traded at before the investigation was disclosed after rallying more than 12% from its lows.
The sell-off and subsequent rebound in Brazilian equities serve as an excellent reminder of how quickly sentiment can change in the market for both the good and the bad. At the close on 5/18, sentiment towards emerging markets and Brazil, in particular, was extremely cautious if not downright negative. Now, though, investors are a lot more comfortable. As they say, price heals all wounds! On the flipside, as good as things seem today, it wouldn’t take a lot to have investors looking at the markets from an entirely different perspective.

Bespoke Summary of Economic Indicators: 8/8/17
B.I.G. Tips – Years Like 2017: August Edition
Yesterday’s trading session represented the 150th trading day of 2017, and so far investors have nothing to complain about. With a gain of 10.7% through 8/7, 2017 ranks as the fourth best start to a year in the last ten years, behind 2013 (18.6%), 2009 (11.9%) and 2012 (11.4%). Earlier today, we took a look at years that had the most similarity to 2017 in terms of the pattern of daily closing prices to see which years since 1928 have the greatest similarity to 2017, and more importantly, how the S&P 500 performed for the remainder of each of those years.

The results of the analysis showed a clear trend in the market’s performance for the remainder of the year. For instant access, sign up for a monthly Bespoke Premium membership now!
Small Business Confidence Bounces Back
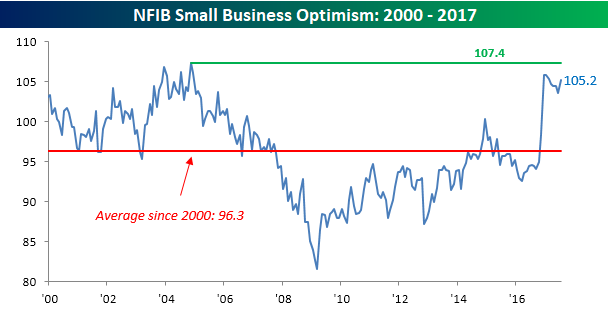
After five straight months of declining or flat readings in small business optimism, July’s update from the NFIB showed a big turnaround. With economists expecting the headline index to come in at a level of 103.5, the actual reading came in at 105.2. This puts the index back within a point of its cycle high and indicates that despite a lack of progress in DC, small business owners are seeing improved conditions on the ground. The commentary of the report said as much when it stated that, “Apparently economic activity in the second quarter was good enough to divert owner attention from the impotence of Washington lawmakers. There’s nothing like more customers to make owners happy, and optimism held up as did important measures of spending and hiring plans. Congress still holds the key to faster growth, so let’s hope they open the door.”
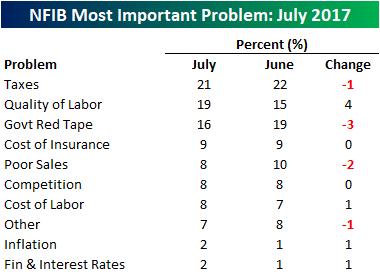
The table below summarizes the issues that small business owners consider to be the biggest problems facing their operations. Topping the list once again this month is Taxes, which was cited by 21% of respondents. Taking the number two spot this month was Quality of Labor, which saw the largest increase and was cited by 19% of business owners. Number three on the list was Government Red Tape, which declined from 19% down to 16%. The only other notable decliner was Poor Sales, as just 8% of small business owners are having a hard time generating sales.
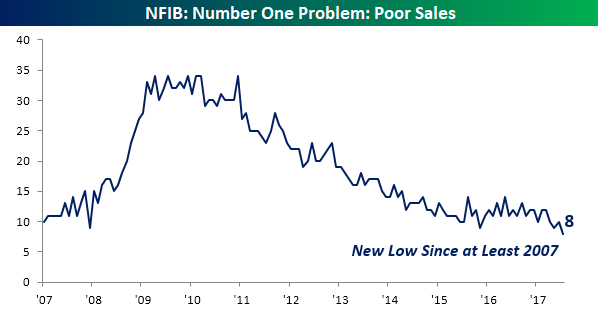
A few charts from the table above are worth highlighting. First, when it comes to the problem of Poor Sales, there really isn’t one. Going back to at least 2007, there have never been fewer small businesses citing Poor Sales as a problem. From one perspective, this is encouraging, but one could argue that it would be hard for things to get much better than they are now.
One of the biggest issues facing workers during this expansion has been the lack of meaningful wage growth. While we feel as though calling for higher wage growth around the corner is reminiscent of Waiting for Godot, small business owners are increasingly citing labor issues as their number one problem, and in theory, at least, that should translate to higher wages. In this month’s report, 19% of small business owners cited Quality of Labor as their number one issue, and that’s tied for the highest reading on record and an increase of four percentage points from last month.

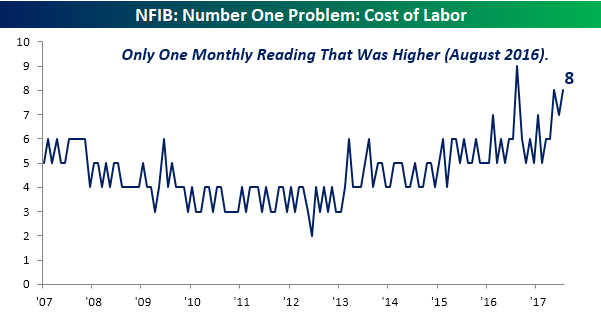
When labor quality is lacking, employers tend to have to pay up for higher quality labor, and that is showing up in the percentage of small business owners citing the cost of labor as their number one issue. In this month’s survey, that percentage ticked up to 8%. Since 2007, there has only been one other month where more businesses cited labor costs as their biggest problem (August 2016).
Bespoke’s Post-Market Closer — Lots of Bubble Talk Lately — 8/7/17
Log-in here if you’re a member with access to the Closer.
Looking for deeper insight on global markets and economics? In tonight’s Closer sent to Bespoke Institutional clients, we focus on all of the “bubble” chatter we’ve been hearing lately regarding the stock market and the Tech sector more specifically. The chart below is one of many included in tonight’s report that compares the current bull market that began on 3/9/09 to the longest bull market on record that ran from December 1987 through March 2000.

The Closer is one of our most popular reports, and you can sign up for a free trial below to see it!
See today’s post-market Closer and everything else Bespoke publishes by starting a no-obligation 14-day free trial to our research platform!