The Closer – 8/10/17 – Still the Calmest Year Since 1973
Log-in here if you’re a member with access to the Closer.
Two days ago on our blog site, in a post titled “What a Difference Less Than Three Months Can Make,” we showed a chart of how quickly the Brazilian Ibovespa recovered from the late May sell-off related to corruption charges against President Temer. In referencing the quick turnaround, we noted that, “The sell-off and subsequent rebound in Brazilian equities serve as an excellent reminder of how quickly sentiment can change in the market for both the good and the bad.” We went on to point out that, “as good as things seem today, it wouldn’t take a lot to have investors looking at the markets from an entirely different perspective.” And that’s exactly where we are today. With a 1% decline in the S&P 500 and a 2% decline in the Nasdaq, investors are looking at equities from a much different perspective today than they were just a couple of days ago.
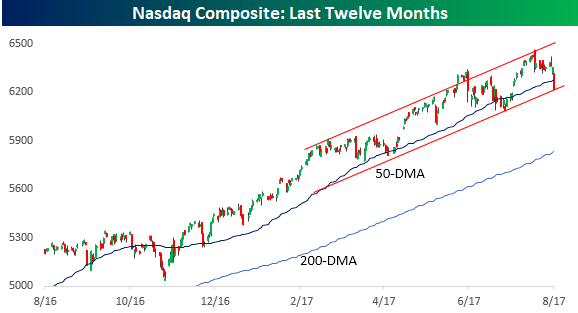
Let’s take a look at the Nasdaq first. After running into resistance at its uptrend channel in late July, it’s the bottom end of that channel that’s coming into play this week. It will be a big test in the coming days to see if this channel can hold, and bulls have their fingers crossed.
In tonight’s Closer sent to Bespoke Institutional clients, we go into more detail on Thursday’s decline and what current trends suggest for the year ahead.
The Closer is one of our most popular reports, and you can sign up for a free trial below to see it!
See today’s post-market Closer and everything else Bespoke publishes by starting a no-obligation 14-day free trial to our research platform!
Bespoke’s Sector Snapshot — 8/10/17
We’ve just released our weekly Sector Snapshot report (see a sample here) for Bespoke Premium and Bespoke Institutional members. Please log-in here to view the report if you’re already a member. If you’re not yet a subscriber and would like to see the report, please start a 30-day trial to Bespoke Premium now.
Below is one of the many charts included in this week’s Sector Snapshot, which shows that the S&P 500 and six sectors are now below their 50-day moving averages (black vertical “N” line). Four of those six sectors are now in oversold territory as well after today’s 1.4% sell-off.

To see our full Sector Snapshot with additional commentary plus six pages of charts that include analysis of valuations, breadth, technicals, and relative strength, start a 30-day free trial to our Bespoke Premium package now. Here’s a breakdown of the products you’ll receive.
ETF Trends: International – 8/10/17
Chart of the Day: Streaks Are Made to Be Broken
Short Interest Report – 8/10/17
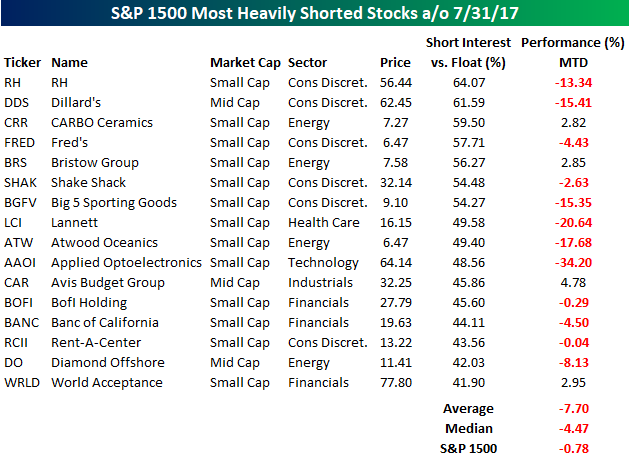
Short interest figures for the end of July were released after the close on Wednesday, so we have just updated our regular report on short interest trends for the market, sectors, and individual stocks for clients. Below we wanted to quickly highlight the stocks with the highest levels of short interest as a percentage of float. The list below shows the 16 stocks in the S&P 1500 that have more than 40% of their free-floating shares sold short. Through early Thursday, the 16 stocks listed below were getting slaughtered with an average decline of 7.7% (median: -4.47%) compared to a decline of 0.78% for the S&P 1500.
Of the 16 names listed, just four stocks are up so far this month, and none of them are up even 5%. To the downside, there is no shortage of big losers with six stocks down more than 10%, including Applied Optoelectronics (AAOI) and Lannett (LCI) which are both down more than 20% in less than eight trading days. If there is one trend that has been constant nearly all year it is that holding stocks with high short interest has been a recipe for big losses.
For a more detailed look at short interest data on a regular basis, sign up for a monthly Bespoke Premium membership now!
Jobless Claims Slightly Higher Than Expected
Jobless claims this week came in slightly ahead of forecasts rising to 244K compared to consensus expectations of 240K. While the report was a bit weaker than expected, it was still the 10th straight week where claims were at or below 250K and the 127th straight week where claims have been below 300K. To find similar streaks, you have to go all the way back to 1973.
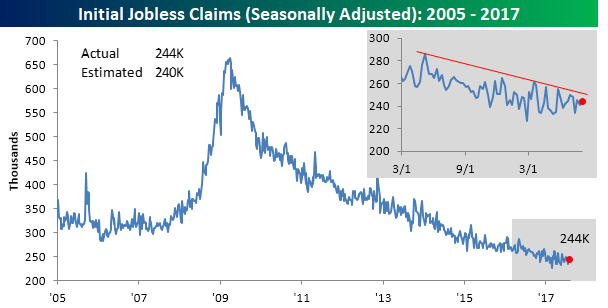
Although claims increased this week, the four-week moving average dropped from 242K down to 241K. That puts the reading within 6K of the multi-decade low of 235.5K from mid-May. That said, given the numbers that will be dropping off in the next couple of weeks, there is pretty much zero chance that we make a new low in the four-week moving average anytime soon.

On a non-seasonally adjusted (NSA) basis, jobless claims increased from 198.8K up to 211.7K. For the current week of the year, however, that is nearly 100K below the average of 309.7K for the current week of the year dating back to 2000. In fact, in the history of the weekly jobless claims data going back to 1968, there has never been an NSA print for the current week of the year that was lower. That’s pretty solid!

the Bespoke 50 — 8/10/17
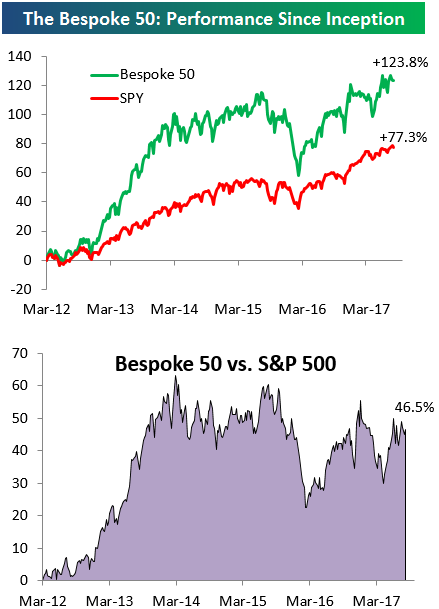
Every Thursday, Bespoke publishes its “Bespoke 50” list of top growth stocks in the Russell 3,000. Our “Bespoke 50” portfolio is made up of the 50 stocks that fit a proprietary growth screen that we created a number of years ago. Since inception in early 2012, the “Bespoke 50” has beaten the S&P 500 by 46.5 percentage points. Through today, the “Bespoke 50” is up 123.8% since inception versus the S&P 500’s gain of 77.3%. Always remember, though, that past performance is no guarantee of future returns.
To view our “Bespoke 50” list of top growth stocks, sign up for Bespoke Premium ($99/month) at this checkout page and get your first month free. This is a great deal!
Bespoke’s Post-Market Closer: Dollar Driver
Log-in here if you’re a member with access to the Closer.
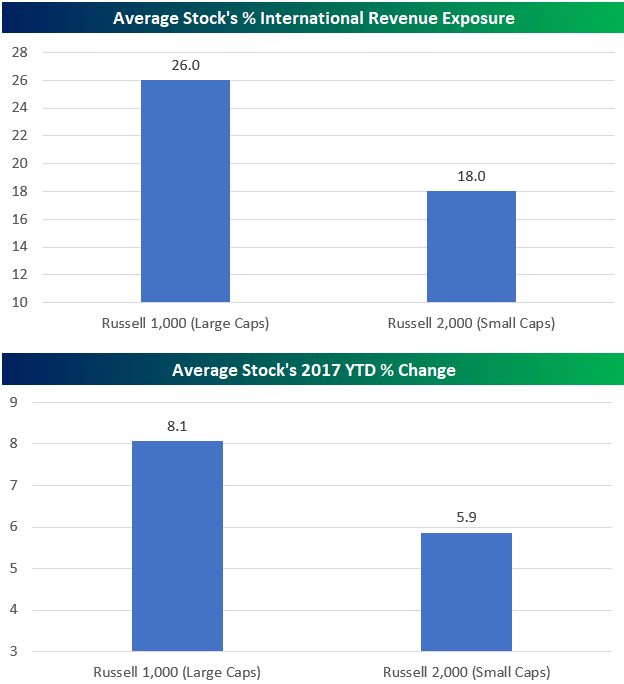
Looking for deeper insight on global markets and economics? In tonight’s Closer sent to Bespoke Institutional clients, we highlight a potential turning point for the US Dollar index and what that might mean for the stock market. The chart below is one of many included in tonight’s report that shows the percentage of international revenues generated by the average large cap stock compared to the average small cap stock. As you can see, large cap stocks generate more revenues outside of the US, which is helpful when the dollar is falling like it has in 2017. Investors have noticed, as the average large cap stock has handily outperformed the average small cap stock on a year-to-date basis (second chart).
The Closer is one of our most popular reports, and you can sign up for a free trial below to see it!
See today’s post-market Closer and everything else Bespoke publishes by starting a no-obligation 14-day free trial to our research platform!