the Bespoke 50 — 12/8/16
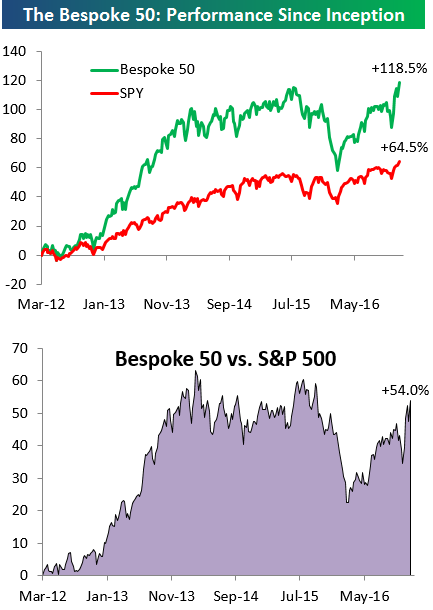
Every Thursday, Bespoke publishes its “Bespoke 50” list of top growth stocks in the Russell 3,000. Our “Bespoke 50” portfolio is made up of the 50 stocks that fit a proprietary growth screen that we created a number of years ago. Since inception in early 2012, the “Bespoke 50” has nearly doubled the performance of the S&P 500. Through today, the “Bespoke 50” is up 118% since inception versus the S&P 500’s gain of 64%.
To view our “Bespoke 50” list of top growth stocks, sign up for Bespoke Premium ($99/month) at this checkout page and get your first month free. This is a great deal!
Election Impact on Sector YTD Performance Ranks
Get Bespoke’s 2017 Outlook Report with a 30-day free trial to Bespoke’s premium research! Click here to learn more.
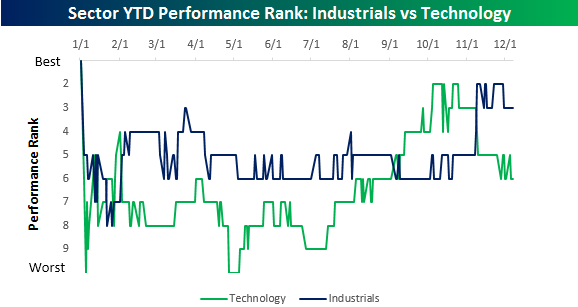
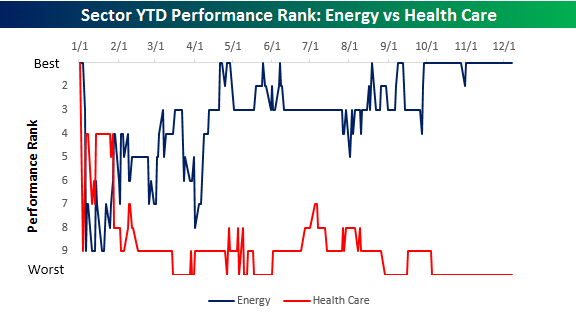
To say that last month’s election was one of the most impactful Presidential elections in recent memory would be an understatement. Sure, there were big moves in the market when President Obama was elected, but in the weeks that followed, stocks across different sectors all moved in the same direction (lower). This time around, the rotation has been something to behold. To illustrate this, in the charts below, we compare YTD performance ranks of the ten major sectors throughout 2016.
To start off, the biggest rotation we have seen is in Financials and Utilities. Throughout most of 2016, Utilities, with their high yields, were the top-performing sector in the S&P 500. Post-election, though, that leadership came crashing down, as the sector has gone from first to nearly worst in the span of four weeks. The sector is still up 8.5% on the year, but that ranks as the fourth worst of the ten sectors. In what has been a mirror image of Utilities, the Financial sector has gone from worst to nearly first over the same span. With a gain of 21% on the year, the only other sector doing better YTD is Energy (23.5%).
While the magnitude of the shift has been smaller, Industrials and Technology have seen a similar shift in their YTD performance ranks. As recently as late October, Technology was the second best performing sector YTD, but now ranks at just the sixth best. Industrials, on the other hand, have moved from sixth best up to the third best.
Finally, while many sectors have seen big shifts in their YTD performance ranks, two sectors that have seen little impact in their ranks are Energy and Health Care. The Energy sector was and continues to be the top performing sector, while Health Care has remained in the cellar. Immediately after the election, Health Care (Drugs and Biotech more specifically) got a lift as Clinton’s loss was seen as a positive signal that these companies wouldn’t have a foe in the White House. What the market failed to take into account, though, was that Trump’s rhetoric towards the sector hasn’t exactly been friendly – a theme that was reinforced in his Person of the Year interview in Time earlier on Wednesday. When it comes to drug pricing, Health Care stocks don’t have many friends in DC on either side of the aisle right now.
Global Equities Moving Higher But Not All Countries Are Extended
Get Bespoke’s 2017 Outlook Report with a 30-day free trial to Bespoke’s premium research! Click here to learn more.
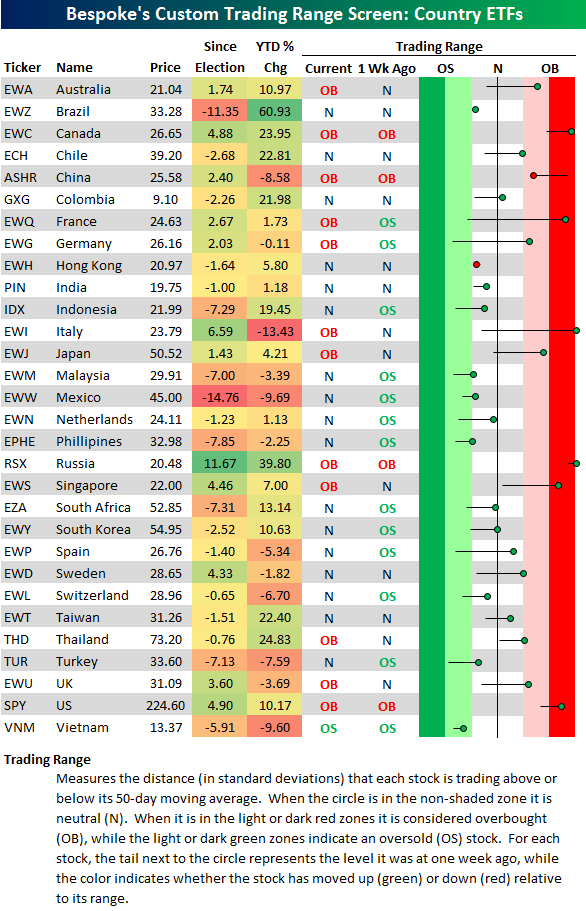
Below is an updated look at our global equity market trading range screen using 30 of the largest country stock market ETFs traded on US exchanges. For each ETF, the dot represents where it’s currently trading within its range, while the tail end represents where it was trading one week ago. The black vertical “N” line represents each ETF’s 50-day moving average, and moves into the red or green zones are considered overbought or oversold.
When the dot is to the right of the tail, the ETF has upside momentum, and vice versa when the dot is to the left of the tail. In regards to overbought/oversold levels, when prices move to extremes in either direction, we typically look for an eventual mean reversion.
While the US has been in rally mode since the election, not all countries have seen the same returns. In fact, even after today’s big global rally, just 12 of the 30 country ETFs we track are in overbought territory. And most countries just spiked into overbought territory Thursday, especially European ones.
Notably, the two most overbought countries in our screen are Italy (EWI) and Russia (RSX). While Italy is still down 13% year-to-date, it’s now up 6.6% since the US election. And Russia’s stock market (RSX) has more than doubled the gain that the S&P 500 (SPY) has seen since the election.
The worst two performing countries since the election are Mexico (EWW) and Brazil (EWZ). While Brazil is down 11.35% since the election, it’s still up 61% year-to-date. Mexico, on the other hand, is down 14.76% since the election and 9.7% year-to-date.
The Closer 12/7/16 – Lower Movement And Labor Market Dynamism
Log-in here if you’re a member with access to the Closer.
Looking for deeper insight on global markets and economics? In tonight’s Closer sent to Bespoke Institutional clients, we discuss falling numbers of movers around the country.
The Closer is one of our most popular reports, and you can see it and everything else Bespoke publishes by starting a no-obligation 14-day free trial to our research!
Consumer Pulse: Job Security Concerns
Each month, Bespoke runs a survey of 1,500 US consumers balanced to census. In the survey, we cover everything you can think of regarding the economy, personal finances, and consumer spending habits. We’ve now been running the monthly survey for more than two years now, so we have historical trend data that is extremely valuable, and it only gets more valuable as time passes. All of this data gets packaged into our monthly Bespoke Consumer Pulse Report, which is included as part of our Pulse subscription package that is available for either $39/month or $365/year. We highly recommend trying out the service, as it includes access to model portfolios and additional consumer reports as well. If you’re not yet a Pulse member, click here to start a 30-day free trial now! Below we highlight the results of a question we ask regarding concerns about job security. This is one of literally hundreds of data points included in each monthly report.
Each month, we present the statement “I am concerned that I will lose my job” and ask consumers to rate their feelings from 1 (Strongly Agree) to 5 (Strongly Disagree). In the chart below, we break out the responses from our November survey. Here we see that more than half of respondents report little concern over losing employment, with only 18% concerned to any degree.
Want to see how this reading has trended over time? If you’re not yet a Pulse member, click here to start a 30-day free trial and view our full November Pulse report.
Bespoke Summary of Economic Indicators: 12/7/16
Chart of the Day – Economic Indicator Diffusion Index Back in the Black
The 100-Point Move — Not What It Once Was
Get Bespoke’s 2017 Outlook Report with a 30-day free trial to Bespoke’s premium research! Click here to learn more.
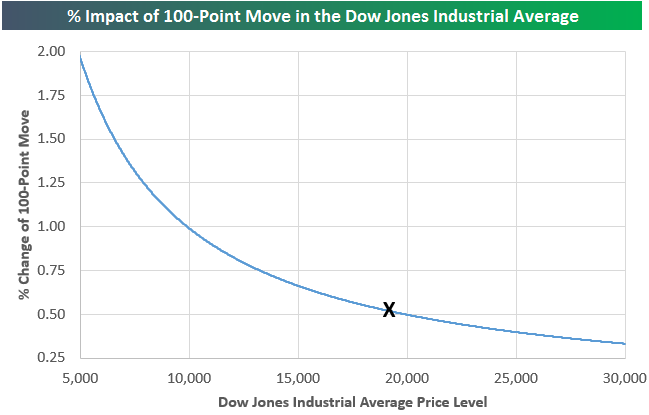
At one point this morning we looked up and saw the Dow up 130 points, but in percentage terms, the index was up just two-thirds of a percent. With the Dow currently trading at 19,440, a triple-digit move just barely cracks a move of half a percent. And if the Dow gets up to 20,000, obviously that means a 100-point gain translates into a move of exactly half a percent. Yep, 100-point moves just aren’t what they once were. “Back in the good ‘ole days, a 100-point move meant something.”
Below is a chart that shows the impact of a 100-point Dow move in percentage terms based on where the index is trading in price. This is obviously common-sense stuff, but we thought it was worth posting given that the index is quickly approaching the 20,000 mark. From a psychological perspective, a 100+ point Dow move still seems like a big gain or decline in the minds of most investors, but the reality is that at these levels, the index needs to move 200+ points to be categorized as a “big move.” Over time the psychological adjustment will be made, but for now it’s likely that investors are viewing daily Dow point moves as more impactful than they really are.
Fixed Income Weekly – 12/7/16
Searching for ways to better understand the fixed income space or looking for actionable ideals in this asset class? Bespoke’s Fixed Income Weekly provides an update on rates and credit every Wednesday. We start off with a fresh piece of analysis driven by what’s in the headlines or driving the market in a given week. We then provide charts of how US Treasury futures and rates are trading, before moving on to a summary of recent fixed income ETF performance, short-term interest rates including money market funds, and a trade idea. We summarize changes and recent developments for a variety of yield curves (UST, bund, Eurodollar, US breakeven inflation and Bespoke’s Global Yield Curve) before finishing with a review of recent UST yield curve changes, spread changes for major credit products and international bonds, and 1 year return profiles for a cross section of the fixed income world.
In this week’s note, we take some time to discuss the relationship between yuan spot and the forwards/options market.
Our Fixed Income Weekly helps investors stay on top of fixed income markets and gain new perspective on the developments in interest rates. You can sign up for a Bespoke research trial below to see this week’s report and everything else Bespoke publishes free for the next two weeks!
Click here to start your no-obligation free Bespoke research trial now!
ETF Trends: Fixed Income, Currencies, and Commodities – 12/7/16
Italy continued to lead the pack among country ETFs while natural gas prices have soared into the winter months on slightly colder weather. Steel, metals and mining, and oil services also continue to rally while gold miners have actually made a small comeback of late. Losing out are health care stocks: biotech, pharma, and health care are all weaker. Joining them are MLPs, semiconductors, and China.
Bespoke provides Bespoke Premium and Bespoke Institutional members with a daily ETF Trends report that highlights proprietary trend and timing scores for more than 200 widely followed ETFs across all asset classes. If you’re an ETF investor, this daily report is perfect. Sign up below to access today’s ETF Trends report.
See Bespoke’s full daily ETF Trends report by starting a no-obligation free trial to our premium research. Click here to sign up with just your name and email address.
