Bespoke Consumer Pulse Report — July 2017
Bespoke’s Consumer Pulse Report is an analysis of a huge consumer survey that we run each month. Our goal with this survey is to track trends across the economic and financial landscape in the US. Using the results from our proprietary monthly survey, we dissect and analyze all of the data and publish the Consumer Pulse Report, which we sell access to on a subscription basis. Sign up for a 30-day free trial to our Bespoke Consumer Pulse subscription service here. With a trial, you’ll get coverage of consumer electronics, social media, streaming media, retail, autos, and much more. The report also has numerous proprietary US economic data points that are extremely timely and useful for investors.

Boeing Puts the Dow on its Shoulders
In sports, it’s common for good teams to have a clutch player they can count on at big moments to take the team to the next level. For the DJIA, Boeing (BA) has been that player. Boeing has accounted for more than a quarter of the DJIA’s 10%+ return this year, and in July alone, BA was responsible for more than half of the index’s 2.5% gain. Because the DJIA is price-weighted and BA has the highest share price in the index, it is also the stock with the largest weighting, but even taking that into account, BA has out-pulled its weight by several orders of magnitude.
Along with BA, other DJIA components that had a hot hand in July were UnitedHealth (UNH) and Caterpillar (CAT), which each accounted for more than 8% of the gain in July. Verizon (VZ) was also impressive. Although its weight in the index is only 1.5%, VZ accounted for 4.7% of July’s gain.
While these stocks did well in July, a number of stocks are in a slump. 3M (MMM), which has been a big contributor the DJIA’s gain this year, had a horrendous July. The same can also be said of Home Depot (HD). The biggest drag on the year, though, has been IBM. Both this year and in July, IBM has been the biggest downside drag to the DJIA. In years past, IBM had been a reliable stock, but in recent years, it’s more of an automatic out.

The Closer — Loans & Capex — 7/31/17
Log-in here if you’re a member with access to the Closer.
Looking for deeper insight on global markets and economics? In tonight’s Closer sent to Bespoke Institutional clients, we summarize the Fed’s Senior Loan Officer Outlook Survey (SLOOS), as well as a few other data points for the US and Mexico released today.

The Closer is one of our most popular reports, and you can sign up for a free trial below to see it!
See today’s post-market Closer and everything else Bespoke publishes by starting a no-obligation 14-day free trial to our research platform!
Forget About F.A.N.G. – It’s All About the “Failing” Times
It seems not a day goes by where we don’t hear about the performance of the F.A.N.G. stocks and how they do nothing but go up. Even with Amazon’s (AMZN) current decline of nearly 10% from its intraday all-time high last week, the F.A.N.G. stocks are up an average of over 30% since the election. While no one is going to quibble with a 30% gain, the return of the F.A.N.G. stocks look nothing more than utilitarian when compared to the performance of the New York Times (NYT) during this same period. Helped in part by strong earnings this quarter, the Times has put up practically “all the returns that are fit to print” with a not so failing rally of 70% since the election!

Chart of the Day – S&P 500 Returns Relative to History
Best and Worst Performing Stocks on Earnings
Through last Friday, the average one-day change of the roughly 1,000 stocks that have reported earnings this season is -0.78%. This means investors are doing more selling than buying immediately following earnings reports this season. But of course…we’ve seen our fair share of winners this season. Below is a list of the stocks that have reported EPS that have gained more than 8% on their earnings reaction days.
As shown, Scientific Games (SGMS) ranks first with a one-day gain of 27.19% on July 24th. Arkansas Best (ARCB) ranks second with a gain of 25.35%, followed by iRobot (IRBT), Sarepta Therapeutics (SRPT), and Lemaitre Vascular (LMAT). Other notables on the list of big winners this season include Boston Beer (SAM), Netflix (NFLX), Align Tech (ALGN), Boeing (BA), Baidu (BIDU), First Solar (FSLR), and the New York Times (NYT).

On the downside, MicroStrategy (MSTR) has been the biggest loser with a one-day decline of 26% on 7/28 (it reported after the close on 7/27). Tile Shop (TTS) ranks 2nd at -25.93%, followed by MarineMax (HZO), PCM (PCMI), Echo Global (ECHO), and Triumph Group (TGI). Other notables on the list of losers that fell 10%+ on their earnings reaction days include Seagate (STX), Akamai (AKAM), Twitter (TWTR), and Buffalo Wild Wings (BWLD).
Start a 14-day free trial to Bespoke’s premium research platform for more in-depth earnings season trend analysis.

B.I.G. Tips – August 2017 Seasonality
Bespoke Stock Seasonality: 7/31/17
ETF Trends: Hedge – 7/31/17
US Oil leads the charge this week in our weekly ETF Trends Report, up over 6% on a 5 day rolling basis. Coffee and Energy have also been fixtures on the left side of this chart as of late, especially the past 2 weeks. Other notable outperformers include Retail and Gold Miners, both up over 3%. Biotech and Health Care providers have seen relatively significant losses as of late, most likely a reaction to the stalemate surrounding the Senate health care bill. Other recurring undeperformers are Transports and Natural Gas, down 2% and just above 1%, respectively.

Bespoke provides Bespoke Premium and Bespoke Institutional members with a daily ETF Trends report that highlights proprietary trend and timing scores for more than 200 widely followed ETFs across all asset classes. If you’re an ETF investor, this daily report is perfect. Sign up below to access today’s ETF Trends report.
See Bespoke’s full daily ETF Trends report by starting a no-obligation free trial to our premium research. Click here to sign up with just your name and email address.
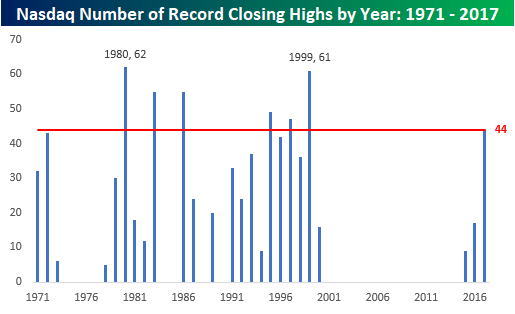
Nasdaq Number of New Highs By Year
While there are still another five months left to go in the year, the Nasdaq has already seen 44 record closing highs in 2017, which ranks as the seventh most for any year since the index’s inception in 1971. So how many more record closing highs do we need to see in order to crack the number one spot? As shown in the chart below, we would need to see just 18 more record closing highs to tie the peak level of 62 back in 1980, and just 17 to tie the peak annual reading during the tech bubble in 1999.
While that seems very doable with five months to go in the year, the most important thing you would need to see in order for 2017 to break the record would be a continuation of the low volatility environment that has been in place all year. Even a pullback in the high single-digit percentage range, which is typical for most years, would stop the steady drumbeat of new highs dead in its tracks.