Bespoke Stock Scores: 8/22/17
ETF Trends: Fixed Income, Currencies, and Commodities – 8/22/17
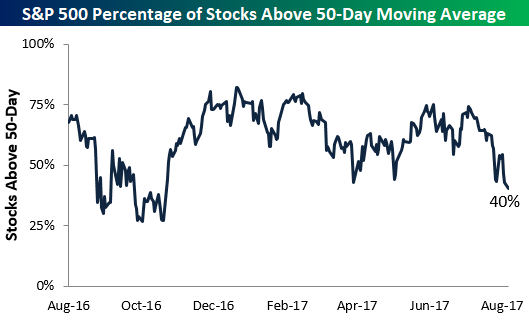
S&P 500 Breadth Streak Could End
At one point during the day yesterday, the percentage of stocks in the S&P 500 trading above their 50-day moving averages dipped down to 39%. Had this breadth measure closed at 39%, it would have been the first time the reading closed below 40% in 198 trading days dating back to November 4th, 2016. A small late-day rally into the close saved the streak yesterday, but entering today the reading is sitting right at 40%. The streak will most likely end with a decline of any magnitude for the S&P today.
Below is a chart showing historical streaks of trading days with 40%+ of S&P 500 stocks closing above their 50-day moving averages. The length of the streak is just another data point showing just how long it has been since we’ve had any kind of market pullback.
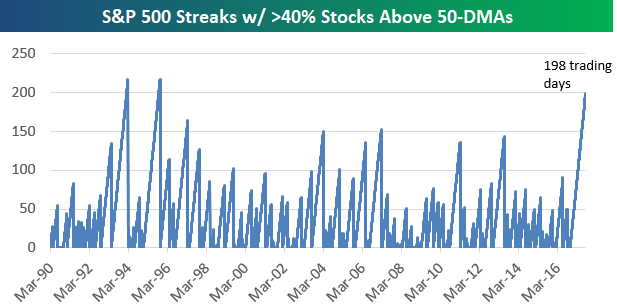
There have only been two longer streaks in the S&P’s history dating back to 1990 when this breadth data begins. In 1994 there was a 216-trading day streak of consecutive 40%+ breadth readings, and in 1995 there was a 217-trading day streak.
Once these long streaks of positive breadth come to an end, there’s a question of what it means. Does the breakdown in breadth finally signal that a more prolonged market pullback has begun, or is it actually a good time to buy?
The table below shows all streaks of 100+ trading days where 40%+ of stocks in the S&P 500 closed above their 50-day moving averages. The date shown is the day the streak came to an end, and next to each date we show how the S&P 500 performed over the next week, month, and three months.
As shown at the bottom of the table, when these streaks have come to an end, the market has performed very well in the near term the large majority of the time. Over the next week, the S&P has averaged a gain of 1.10% with gains 9 out of 13 times (69%). Over the next month, the S&P has averaged a gain of 2.45% with positive returns 10 out of 13 times (77%). And over the next three months, the S&P has averaged a big gain of 4.65% with positive returns 11 out of 13 times (85%). The biggest three-month drawdown seen after these streaks have ended was just -2.67% following the 101-trading day streak that ended on January 13th, 2005.

Gold: Third Time the Charm or Third Strike?
It was less than two weeks ago that we were watching one of the cable news networks, and the panel was discussing what viewers should expect in a war with North Korea since so many of them considered it a sure thing. The next week, the same panel had moved on from North Korea and was discussing the process by which President Trump will leave office. For all this reported chaos in the world right now, one would think that the price of gold would be seeing at least a little action, but over the last four months or so, it has merely been bouncing around between $1,200 and $1,300, or a range of less than 8%. In the most recent leg higher, gold has once again tested the top end of its range and for now, at least, it has been stopped in its tracks. Will the third time be the charm for gold or are we in for just more of the range?

The Closer — Chicago Potpourri — 8/21/17
Log-in here if you’re a member with access to the Closer.
Looking for deeper insight on global markets and economics? In tonight’s Closer sent to Bespoke Institutional clients, we update our tracking of GDP growth based on the Chicago Fed National Activity Index, review the impact of FX on trade for two large economies, and note the implications of a series of daily declines in USDJPY.

The Closer is one of our most popular reports, and you can sign up for a free trial below to see it!
See today’s post-market Closer and everything else Bespoke publishes by starting a no-obligation 14-day free trial to our research platform!
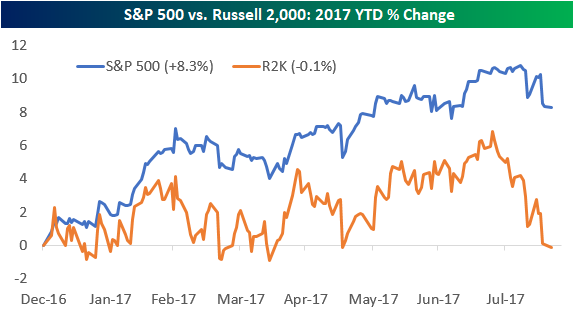
S&P 500 vs. Russell 2,000: Year To Date Relative Performance
While it made an attempt to close the day in the green, the Russell 2,000 small-cap index finished down 7 basis points on Monday. This is notable because it left the index in the red on a year-to-date basis.
As shown below, the Russell 2,000 is lagging the large-cap S&P 500 badly in 2017. Through today’s close, the S&P is outperforming the Russell by roughly 8.3 percentage points YTD.
Below is a table showing the year-to-date performance of both the S&P 500 and Russell 2,000 at this point in each year since 1979 (the Russell 2,000’s inception point). For each year, we also show how the two indices performed for the remainder of the year.
At this point in the year (160 trading days), 2017 is only the third year in which the S&P 500 was up while the Russell 2,000 was down. It’s also been the third worst year ever for the Russell 2,000 on a relative basis versus the S&P 500 at this point in the year.
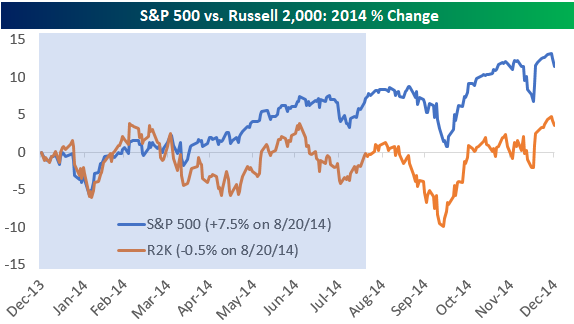
Interestingly, we saw a very similar underperformance scenario for the Russell 2,000 just 3 years ago in 2014. Through 160 trading days in 2014, the S&P 500 was up 7.47% compared to the Russell 2,000’s decline of 0.53%. In that year, both indices gained from August 21st through year-end, with the Russell slightly out-gaining the S&P (+4.08% vs. +3.64%).
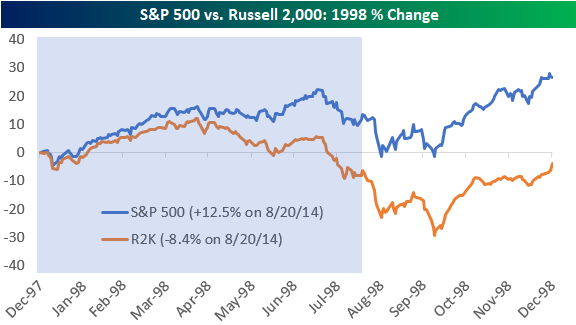
The other year where the S&P 500 was up at this point while the Russell was down was in 1998. In that year the Russell underperformance was more than 2x as bad, though. While the S&P 500 was up 12.49% on August 20th, 1998, the Russell 2,000 was down 8.38%! In that year, the S&P 500 went on to gain another 12.61% for the remainder of the year, while the Russell only gained another 4.96%.

Below we provide chart patterns of the S&P 500 vs. Russell 2,000 in both 2014 and 1998, with the blue shading representing the first 160 trading days of each year.
Energy’s Lost Decade
You know you’re getting old when you can’t remember the last time Energy stocks were a market leader. The chart below shows the relative strength of the S&P 500 Energy sector versus the S&P 500 going back to August 1989. When the line is rising, it indicates periods where Energy is outperforming the S&P 500, while periods of Energy sector underperformance are indicated by falling lines. The period from September 1990 through January 1999 was one where the sector was out of favor, and it was towards the end of it when Exxon merged with Mobil and then Chevron merged with Texaco. At the time those mergers were announced, the sector was right in the midst of putting in a multi-year bottom that sparked a nine-year period of major outperformance by the sector.
Like all good parties, though, the music eventually stopped for the Energy sector in July 2008 just as the Financial Crisis was unfolding. From that peak up until now, Energy has been a major underperformer versus the S&P 500 and given up nearly all of its prior outperformance. Even more noteworthy, though, is the fact that the current period of underperformance has now lasted longer (9 years, 1 month) than the 8 years and 4-month stretch that spanned the majority of the 1990s. We have noted in the past that overcapacity looms as one of the major impediments to a sustainable rally in the Energy sector, and one way to remedy that is through consolidation. That’s exactly what happened in the late 1990s, but this time around we have yet to see any really big headline-grabbing mergers in the space.
Start a 30-day free trial to Bespoke’s Premium service for our most actionable ideas.

Chart of the Day – Big Bets Against Small Caps
Bespoke Stock Seasonality – 8/21/17
Bespoke Brunch Reads: 8/20/17
Welcome to Bespoke Brunch Reads — a linkfest of the favorite things we read over the past week. The links are mostly market related, but there are some other interesting subjects covered as well. We hope you enjoy the food for thought as a supplement to the research we provide you during the week.
See this week’s just-published Bespoke Report newsletter by starting a no-obligation two-week free trial to our premium research platform.
Housing
Baby Boomers Who Refuse to Sell Are Dominating the Housing Market by Prashant Gopal (Bloomberg)
Older Americans are refusing to sell, meaning a dearth of availability for younger buyers…especially relatively close to attractive amenities near city centers. [Link]
Homebuyers put less and less skin in the game, adding to the market’s overall risk by Diana Olick (CNBC)
The most buyers in seven years (1.5mm) bought houses with a down payment less than 10% of the home’s value. While that may sound like the housing bubble, modern mortgages are almost always much simpler, with few or no teaser rates, balloon payments, short terms, or confusing amortizations. [Link; auto-playing video]
A 2:15 Alarm, 2 Trains and a Bus Get Her to Work by 7 A.M by Conor Dougherty and Andrew Burton (NYT)
With prices on the San Francisco peninsula spiraling and cost of living moving up accordingly, the only solution for some workers is to retreat further out, at the expense of jaw-dropping commute times. [Link; soft paywall]
Emerging Markets
China modernises its monetary policy (The Economist)
A very helpful review of the efforts made by the PBoC to shift the Chinese monetary system away from quotas and guidance on loan volume and towards a rate-driven policy regime. [Link; paywall]
How India’s Debt Could Kill Its Growth by Daniel Stacey and Kara Dapena (WSJ)
A review of the extremely large nonperforming loan balances at Indian banks, with an eye to how that defaulted or defaulting credit may be holding back economic growth. [Link; paywall]
Labor Markets
The Rising Return to Non-Cognitive Skill by Per-Anders Edin, Peter Fredriksson, Martin Nybom, and Björn Öckert (Deutsche Post Institute of Labor Economics)
A quantitative review of stronger wage growth and broad economic returns for workers which have inter-personal or social dynamics instead of purely routine functions. [Link; 35 page PDF]
The Good News on Wage Growth by Mary C. Daly, Bart Hobijn, and Joseph Pedtke (SF Fed Blog)
A quantitative assessment of how much demographics are impacting wage growth, with lower-paid young workers entering and higher-paid older workers exiting. [Link]
Investors
Dalio’s Quest to Outlive Himself by Katherine Burton and Saijel Kishan (Bloomberg)
Dynastic goals and principles for life from the manager of the world’s largest hedge fund. [Link]
The Quant Fund Robot Takeover Has Been Postponed by Dani Burger (Bloomberg)
Market neutral programmatic funds have lagged badly in 2017 after tons of hype about algorithms, AI, and the human-free future of investing. [Link; auto-playing video]
Apps
See the cool kids lined up outside that new restaurant? This app pays them to stand there. by Peter Holley (WaPo)
Were you looking for an “Uber but for crowds of engaged people at a new business”? Congratulations! You’ve found exactly that. [Link; soft paywall]
Their invention is valued at $250 million. Here’s why they’re not satisfied by Andy Rosen (Boston Globe)
A profile of a company that developed a new approach to cloud storage with its own cryptocurrency; the founder now says “I think this is going to end in tears”. [Link]
Silicon “Solutions”
The Way You Use Instagram Can Show if You’re Depressed by Aric Jenkins (Fortune)
An algorithmic approach developed by scholars at the University of Vermont and Harvard claims to be able to identify depression about 70% of the time based only on users’ Instagram posts. [Link]
When Silicon Valley Took Over Journalism by Franklin Foer (The Atlantic)
The story of a tech takeover of The New Republic, and what it means for the world of journalism more broadly as platforms (Facebook, Google, Twitter) devour revenues that digital content shops were supposed to be able to share between themselves. [Link]
Bubbles
The warnings from history that Wall Street ignored by John Authers and Alan Smith (FT)
A graphic summary of bubbles of the past, both historic (tulips and railways) and recent (emerging markets and housing). [Link; paywall]
Branding
How the Big Baller Brand is trying to disrupt the entire sneaker industry by Nick DePaula (ESPN)
Understanding the Ball family, whose sons can hoop and whose father aims to become a sneaker mogul. [Link; auto-playing video]
Icahn
Carl Icahn’s Failed Raid On Washington by Patrick Radden Keefe (The New Yorker)
With Icahn resigning from his advisory post this week amidst the dissolution of other Presidential advisory councils, a review of his efforts to benefit from lending a hand to the Trump Administration. [Link]
Germany
Germany’s new divide (The Economist)
A fascinating explanation of the new divide in Germany: no longer riven by the former east-west border between democracy and totalitarianism, instead the new divide is between north and south. [Link; paywall]
Apple and Aetna hold secret meetings to bring the Apple Watch to millions of Aetna customers by Christina Farr (CNBC)
One of the nation’s largest health insurers already hands out Apple Watches to its employees. Could its insurance clients be next? [Link; auto-playing video]
World Gone To Pot
Holy smoke! The church of cannabis by Aaron Millar (The Guardian)
A Denver non-profit runs a church dedicated to cannabis, including its own chapel and theology. [Link]
Have a great Sunday!