Fixed Income Weekly – 9/27/17
Searching for ways to better understand the fixed income space or looking for actionable ideals in this asset class? Bespoke’s Fixed Income Weekly provides an update on rates and credit every Wednesday. We start off with a fresh piece of analysis driven by what’s in the headlines or driving the market in a given week. We then provide charts of how US Treasury futures and rates are trading, before moving on to a summary of recent fixed income ETF performance, short-term interest rates including money market funds, and a trade idea. We summarize changes and recent developments for a variety of yield curves (UST, bund, Eurodollar, US breakeven inflation and Bespoke’s Global Yield Curve) before finishing with a review of recent UST yield curve changes, spread changes for major credit products and international bonds, and 1 year return profiles for a cross section of the fixed income world.
In this week’s note, we take a look at relative real effective exchange rates across EM economies.

Our Fixed Income Weekly helps investors stay on top of fixed income markets and gain new perspective on the developments in interest rates. You can sign up for a Bespoke research trial below to see this week’s report and everything else Bespoke publishes free for the next two weeks!
Click here to start your no-obligation free Bespoke research trial now!
Short Interest Report – Most Heavily Shorted Stocks
Short interest figures for the middle of September were released after the close on Tuesday, so we have just updated our regular report on short interest trends for the market, sectors, and individual stocks for clients. Below we wanted to quickly highlight the stocks with the highest levels of short interest as a percentage of float. The list below shows the 29 stocks in the S&P 1500 that have more than a third of their free-floating shares sold short. Through yesterday’s close, the 29 stocks listed below have been crushing the market with an average gain of 8.14% (median: 6.03%) compared to the 1.24% gain for the S&P 1500. So unlike August where the most heavily shorted stocks were creamed, they’ve seen quite a bounce-back in September.
Of the 29 names listed, just six stocks are down so far this month, and none of them are down by 10%. To the upside, six stocks are up by over 10%, and four of those have rallied more than 25%! In terms of sector representation, Consumer Discretionary has dominated the list with nearly half (14) of the 29 stocks shown. Behind Consumer Discretionary, the sector with the second most number of stocks listed is Energy with just four, so it’s pretty clear that Consumer Discretionary stocks are very much out of favor.
In terms of individual stocks, the most heavily shorted stock in the S&P 1500 is Applied Optoelectronics (AAOI) which has nearly three-quarters of its float sold short, and behind AAOI another nine stocks have more than half of their float sold short. These names include Dillard’s (DDS), RH (where the CEO just purchased 14K shares on Tuesday), and Shake Shack (SHAK).
For a more detailed look at short interest data on a regular basis, sign up for a monthly Bespoke Premium membership now!

Bespoke’s Global Macro Dashboard — 9/27/17
Bespoke’s Global Macro Dashboard is a high-level summary of 22 major economies from around the world. For each country, we provide charts of local equity market prices, relative performance versus global equities, price to earnings ratios, dividend yields, economic growth, unemployment, retail sales and industrial production growth, inflation, money supply, spot FX performance versus the dollar, policy rate, and ten year local government bond yield interest rates. The report is intended as a tool for both reference and idea generation. It’s clients’ first stop for basic background info on how a given economy is performing, and what issues are driving the narrative for that economy. The dashboard helps you get up to speed on and keep track of the basics for the most important economies around the world, informing starting points for further research and risk management. It’s published weekly every Wednesday at the Bespoke Institutional membership level.
Click here for a special $1 introductory Bespoke Institutional membership rate.

The Closer — The Flexible Fed: Why History Won’t Help You Understand Yellen — 9/26/17
Log-in here if you’re a member with access to the Closer.
Looking for deeper insight on global markets and economics? In tonight’s Closer sent to Bespoke Institutional clients, we put Fed Chair Yellen’s speech today in its proper context. We also discuss the Richmond Fed Manufacturing and Services sector indices updated today.
The Closer is one of our most popular reports, and you can sign up for a free trial below to see it!
See today’s post-market Closer and everything else Bespoke publishes by starting a no-obligation 14-day free trial to our research platform!
B.I.G. Tips – Margin Debt Hits Another Record High
ETF Trends: US Sectors & Groups – 9/26/17
Living in Mom and Dad’s Basement Watching Netflix Isn’t Cool Anymore?
As noted in a post earlier today, Consumer Confidence for the month of September came in slightly weaker than expected. Within each month’s report, there are a number of ways confidence levels are broken out which always uncovers some interesting trends. Two of the most interesting ways to track sentiment is by looking at both income and age.
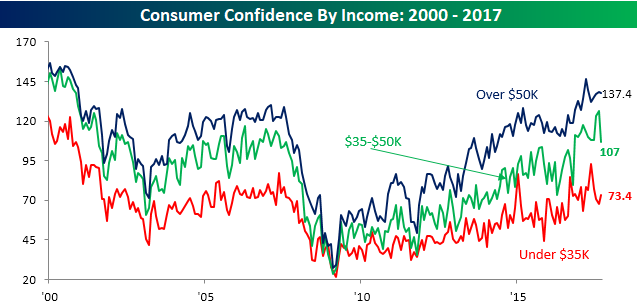
Starting with income levels, there was a real disparity in month/month changes in September. While lower income and higher income consumers saw their confidence levels increase (lower income) or stay steady (upper income), confidence among consumers with incomes of between $35K and $50K plummetted to its lowest level since last October. A lot of President Trump’s base comes from this income group, so if their confidence levels continue to decline, it could spell further trouble for the President in the polls.
Looking at confidence levels by age shows an even more fascinating move. While overall confidence levels showed a slight decline this month, based on age, they were all over the map. Among consumers over the age of 55, the overall confidence level showed a slight decline but still remains right near its highs of the cycle. Middle-aged consumers (aged 35-54), however, saw an increase in optimism with overall confidence increasing from 122 up to 128.2. Where we saw the largest move in confidence, though, was among consumers under the age of 35. In this cohort, overall confidence fell from 126.6 down to 120.9.
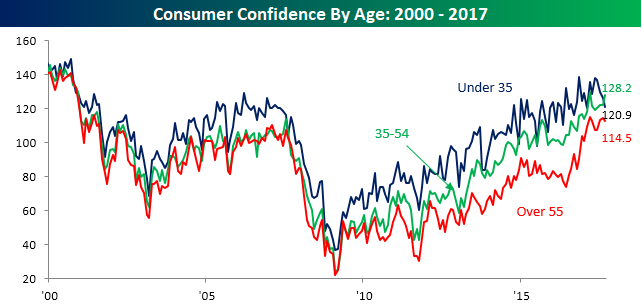
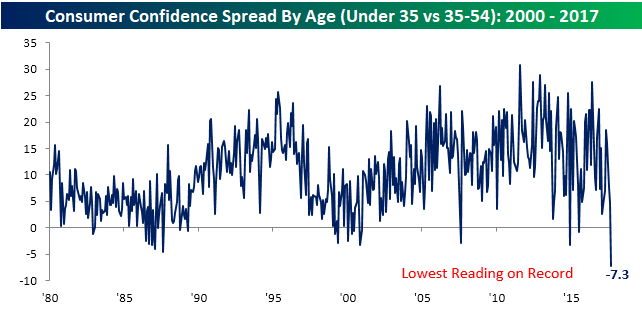
Looking at the chart above, you can see that confidence among younger consumers is almost always greater than older consumers. Looking more closely, though, you can see that in this month’s report middle-aged consumers actually have a higher level of confidence than younger consumers. Looking back over time, it’s uncommon enough that you see this type of reversal, but the magnitude of the current reversal has never been greater. As shown, going back to 1980, the negative 7.1 point spread in confidence among younger consumers (under 35) and middle-aged consumers (35-54) has never been wider. Alas, it was only a matter of time before the idea of living in mom and dad’s basement watching Netflix and piggybacking off their cell phone family plans lost some of its luster.
Gain access to 1 month of any of Bespoke’s membership levels for $1!
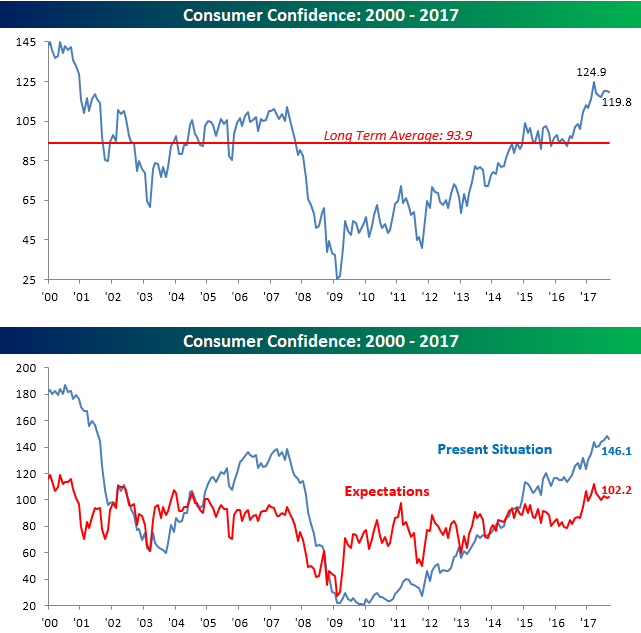
Consumer Confidence Slightly Weaker
Consumer Confidence for the month of September showed a slightly larger than expected downtick, falling from 120.4 down to 119.8 compared to expectations for a drop to 120.0. While overall confidence is down a little over five points from its recent high, it remains comfortably above its long-term historical average of 93.9. Breaking out this month’s report by Present Situation and Expectations, while the Present Situations index pulled back slightly from its cycle-high, the Expectations component actually saw a slight increase.
Gain access to 1 month of any of Bespoke’s membership levels for $1!
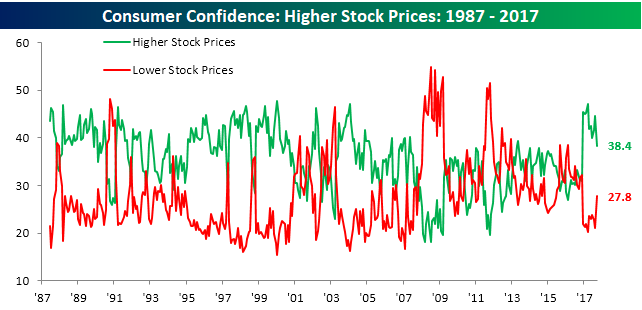
Within this month’s report, one aspect that was interesting was the breakdown of consumers expecting higher or lower stock prices. As shown in the chart below, the percentage of consumers expecting equity prices to rise has fallen to 38.4% from a recent high of 47.1% in March. Conversely, the percentage of consumers looking for lower stock prices has risen from just 20.2% earlier this year up to 27.8% in September. While investors are certainly not as bearish as they were earlier in this bull market, there are still a lot of consumers who view the stock market with trepidation. From a contrarian perspective, that’s a healthy sign.