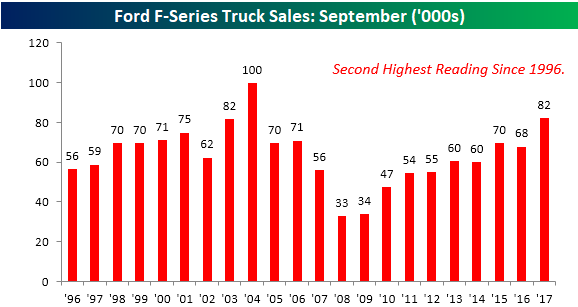
Blowout Truck Sales At Ford
Whether or not the strength has been aided by the loss of the existing fleet due to the hurricanes in the South, auto sales for the month of September have absolutely been on fire. That strength in sales has been evident in truck sales too. We like to track sales of pickup trucks (specifically at Ford) as they are often a sign of strength or weakness in the small business and construction sectors, and based on these numbers from Ford, the small business sector looks strong. In the month of September, total F-Series truck sales at Ford totaled 82.3K. As shown in the chart below, that qualifies as the second strongest September sales total of F-Series trucks for Ford since at least 1996, trailing only September 2004 when total sales were 99.7K.
Gain access to 1 month of any of Bespoke’s premium membership levels for $1!
With this year’s strong September, total YTD sales of F-Series trucks from Ford now total 658.6K. That’s more than 10% above the YTD total through last year at this time and is the fourth highest YTD total through September dating back to 1996. The only years where the YTD run rate was stronger were 2004 (698K), 2005 (695K), and 2000 (683K).
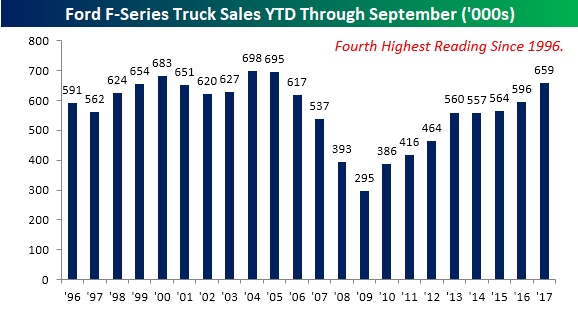
Chart of the Day: Bank Breakout
The Closer — Powerful Market Indicator? — 10/2/17
Log-in here if you’re a member with access to the Closer.
Looking for deeper insight on global markets and economics? In tonight’s Closer sent to Bespoke Institutional clients, we discuss the surge in ISM Manufacturing for the month of September reported today. We also take a look at the rising spread between ISM and Markit PMIs and the soft level of construction spending in the US.

The Closer is one of our most popular reports, and you can sign up for a free trial below to see it!
See today’s post-market Closer and everything else Bespoke publishes by starting a no-obligation 14-day free trial to our research platform!
ETF Trends: Hedge – 10/2/17
B.I.G. Tips – Strong ISM: As Good As it Gets?
Chart of the Day: Winners and Losers of 2017
The Most Volatile Month of the Year
While it has historically been positive, October has the distinction of being known as the most volatile month of the year. What that means in a year where volatility has been non-existent remains to be seen, but if the market was going to become more unsettled at some point, history says that now is the time. Today, we wanted to show two examples of how volatility tends to spike during October. In terms of the S&P 500’s average intra-month range, going back to 1928, the percentage spread between its closing high and low during the month of October has been a staggering 8.30%. That’s more than 1.3 percentage points above the next highest month (November – 7.0%). After October and November, though, volatility really recedes with an average spread of only 5.26% in December.
Gain access to 1 month of any of Bespoke’s premium membership levels for $1!
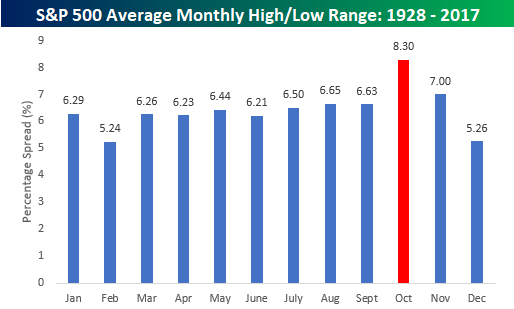
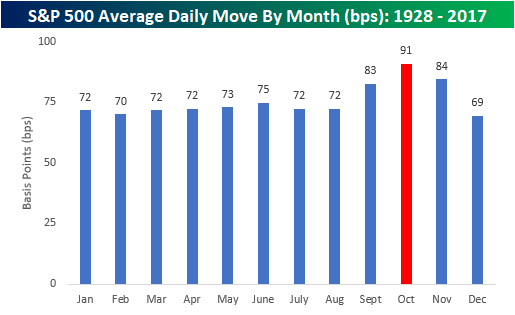
As shown in the chart above, February and December tend to have the smallest intra-month ranges, but February also has the fewest amount of trading days as well, so that skews things. Another way to look at monthly volatility on a more apples to apples basis is by measuring the index’s average daily percentage move (up or down) during each trading day of the month. Using this approach, the picture is very similar; volatility tends to pick up in September, October, and November and then fades in December to close out the year. Once again, October sees the largest average daily percentage move at 91 basis points (bps). In other words, the S&P 500 has historically averaged moves of close to +/-1% on trading days throughout the month of October. The key difference between this chart and the one above is that on this basis volatility in February is right inline with the other first eight months of the year. In fact, it’s pretty striking how average daily volatility tends to be so uniform for the first eight months of the year before going haywire in the final third.
Gain access to 1 month of any of Bespoke’s premium membership levels for $1!
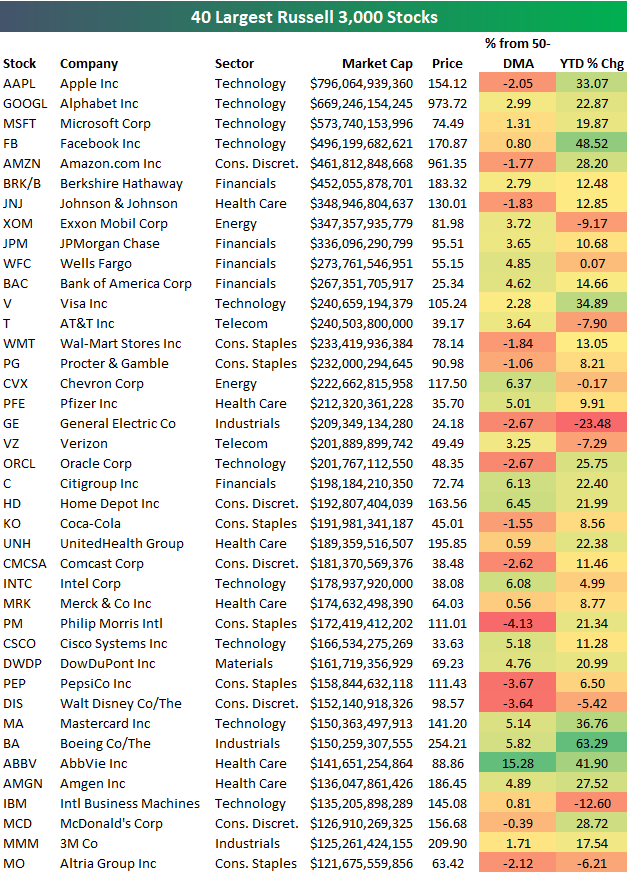
2017 YTD Performance of the 40 Largest Stocks
Below is a look at the year-to-date performance of the 40 largest stocks in the US through the end of the third quarter. As shown, the five biggest companies are all Tech related (even though AMZN is categorized as Consumer Discretionary), and they’re all up 19% or more year-to-date. Of the five largest stocks, Facebook (FB) is up the most this year with a gain of 48.52%.
While Facebook is up the most of the five largest stocks, Boeing (BA) is up the most of the stocks listed with a YTD gain of 63%. General Electric (GE) is the worst performer with a YTD decline of 23.48%.
Gain access to 1 month of any of Bespoke’s premium membership levels for $1!
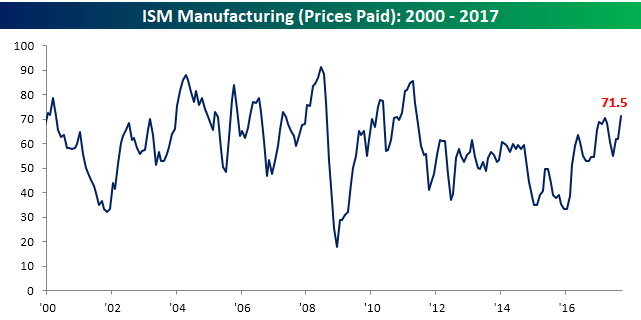
ISM Manufacturing Report in a Word – Strong
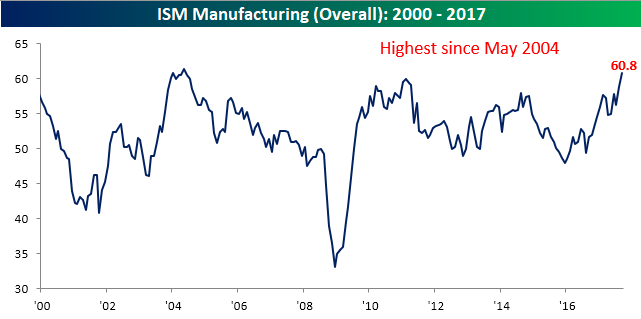
The ISM Manufacturing report for the month of September came in significantly ahead of expectations, topping 60 for the first time in over 13 years. While economists were forecasting the headline index to come in at a level of 58.1, the actual reading came in at 60.8. Relative to expectations, September’s report was the strongest since October 2014, and on an absolute level, this month’s print was the highest since May 2014.
Gain access to 1 month of any of Bespoke’s premium membership levels for $1!
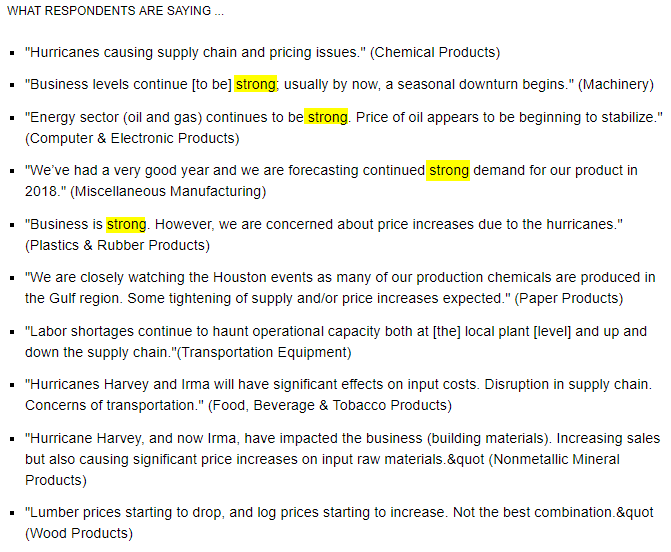
Looking at the commentary of each month’s report helps to get an idea of what issues manufacturers face, and besides the short-term disruption caused by the hurricanes, one word that stands out is “strong.”
The table below shows the m/m and y/y changes in the headline ISM Manufacturing index and each of its subcomponents. On a m/m basis, the only components that declined this month were Business Inventories and Imports. On the upside, the biggest increases were in Prices Paid, Supplier Deliveries, and New Orders. Year/year, Customer Inventories was the only component that declined.
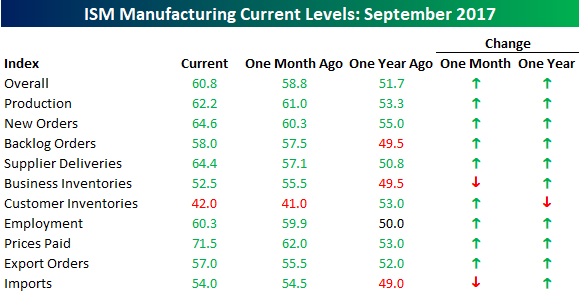
In terms of Prices Paid, this month’s increase was notable as the 9.5 point increase brought that index up to its highest level since May 2011.
Gain access to 1 month of any of Bespoke’s premium membership levels for $1!
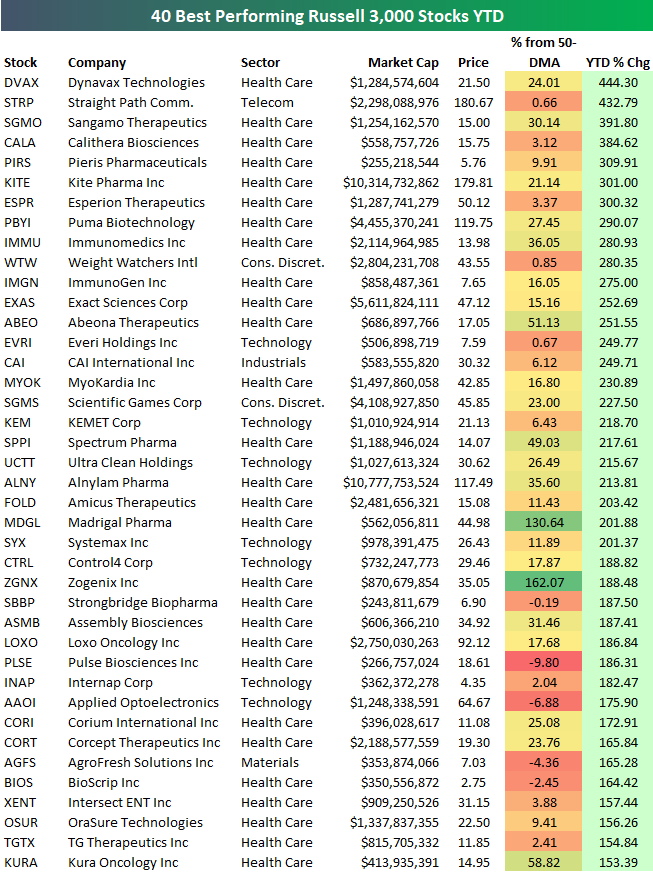
Best Performing Stocks YTD Through Q3 2017
Below is a list of the 40 best performing Russell 3,000 stocks on a year-to-date basis through the third quarter of 2017. You’ll notice that a bulk of the names on the list of biggest winners are from the Biotech space. Dynavax Tech (DVAX) ranks first with a YTD gain of 444%. Straight Path (STRP) ranks second at +432.79% but it’s in the process of getting acquired after a bidding war for the company’s valuable sprectrum. Sangamo Therapeutics (SGMO), Calithera Biosciences (CALA), and Pieris Pharma (PIRS) round out the top five. Eight of the top nine are Biotech stocks, and then Weight Watchers (WTW) ranks tenth with a gain of 280%.
Gain access to 1 month of any of Bespoke’s premium membership levels for $1!
Because so many Biotech companies top the list of winners this year, below is a list of the 40 best performing non-Biotech names in the Russell 3,000. There are 8 companies listed that are up more than 200% year-to-date, including Everi (EVRI), CAI Intl (CAI), Scientific Games (SGMS), and Ultra Clean (UCTT). Other notables on the list include Control4 (CTRL), Lumber Liquidators (LL), Cutera (CUTR), LendingTree (TREE), National Beverage (FIZZ), and Square (SQ). If you have some time this week, browse through these names to see what the back-story is behind the big outperformance this year.
