S&P 500 Quick-View Chart Book — 11/10/17
Underlying Earnings Season Weakness
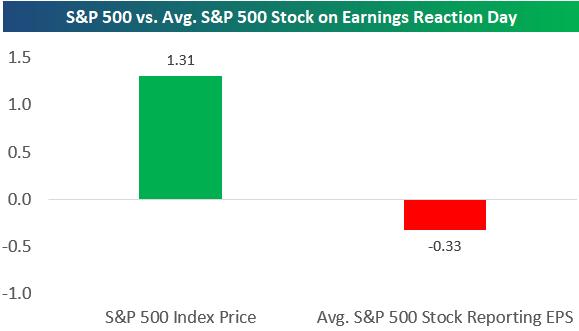
More than 2,300 companies have now reported their Q3 2017 earnings results since earnings season began back on October 9th. With just a week left until the unofficial end of the reporting period, the S&P 500 is up 1.3% since the start of earnings season. While the S&P’s gain is nice to see, the underlying price action of S&P 500 stocks that have reported has been weak. This is a concerning sign. As shown in the chart below, the average S&P 500 stock that has reported EPS this season has fallen 0.33% on its earnings reaction day. This means investors have been doing more selling than buying of individual stocks that make up the S&P 500 in reaction to their earnings news.
Bespoke’s Sector Snapshot — 11/9/17
We’ve just released our weekly Sector Snapshot report (see a sample here) for Bespoke Premium and Bespoke Institutional members. Please log-in here to view the report if you’re already a member. If you’re not yet a subscriber and would like to see the report, please start a two-week free trial to Bespoke Premium now.
Below is one of the many charts included in this week’s Sector Snapshot, which is our trading range chart for S&P 500 sectors. The black vertical “N” line represents each sector’s 50-day moving average, and as shown, 6 of 10 sectors are currently above their 50-days. This week we’ve seen the Industrials sector break below its 50-day, and the Financial sector is getting close. At the same time, we’ve seen the Consumer Staples sector finally pick up a bit and move higher within its range.

To see our full Sector Snapshot with additional commentary plus six pages of charts that include analysis of valuations, breadth, technicals, and relative strength, start a two-week free trial to our Bespoke Premium package now. Here’s a breakdown of the products you’ll receive.
The Closer — Global Equity Momentum Fades — 11/9/17
Log-in here if you’re a member with access to the Closer.
Looking for deeper insight on markets? In tonight’s Closer sent to Bespoke Institutional clients, we review the slowing momentum of global equity markets and GDP growth forecasts for the US and the Eurozone.

The Closer is one of our most popular reports, and you can sign up for a free trial below to see it!
See today’s post-market Closer and everything else Bespoke publishes by starting a 14-day free trial to Bespoke Institutional today!
ETF Trends: Hedge – 11/9/17
Chart of the Day: Food Services Suffering
Biggest Market Cap Gainers Since the 2016 Election
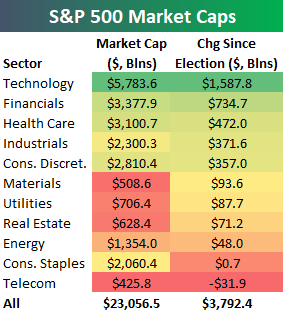
Yesterday we published an in-depth recap of asset class performance since the 2016 Presidential Election. You can view the full report here if you’re interested. One of the stats included in the report was the change in market cap experienced by the S&P 500 and its eleven sectors since last November’s election. As shown below, the S&P 500 has seen its market cap grow by $3.792 trillion since 11/8/16, leaving it with a total market cap of more than $23 trillion as of today.
In terms of sectors, Technology has grown by far the most with an increase in market cap of more than $1.5 trillion. The Financial sector has grown the second-most at only half that amount.
In terms of individual stocks, below is a list of the 35 S&P 500 stocks that have seen the biggest increases in market cap since last November’s Election. Six companies have seen growth of more than $100 billion! Apple (AAPL) has grown the most at $310 billion, followed by Microsoft (MSFT), Alphabet (GOOGL), Amazon (AMZN), Facebook (FB), and Bank of America (BAC).

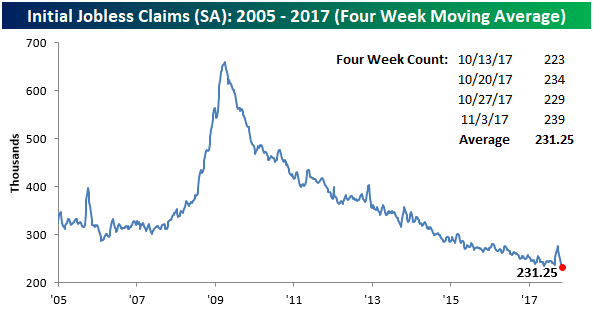
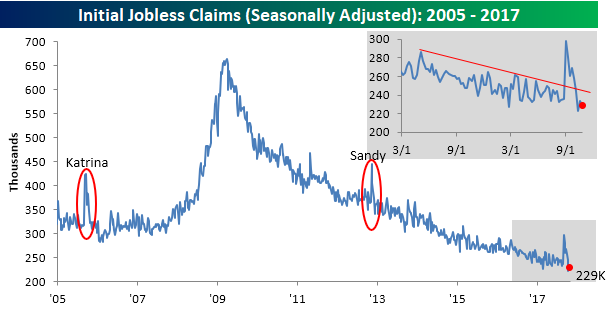
Claims Have Shaken Off Hurricane Impact
Initial jobless claims came in slightly higher than expected at 239,000 for the week ending November 4th, versus 232,000 expected and 229,000 last week. Continuing claims were slightly weaker, rising to 1.901mm versus 1.885 expected and 1.884 previously. While the uptick wasn’t positive, the trend is still very much “down and to the right”.
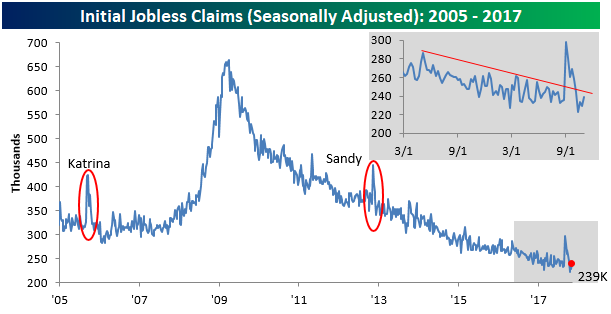
The best way to measure the trend of claims is to look at the 4 week moving average. As shown in the chart below, that 4 week average is the lowest we’ve seen in the current cycle. It’s also the lowest number in more than 40 years, with no other period since 1973 showing claims so low in a 4 week period.
On an non-seasonally adjusted basis, the current week saw claims of less than 220,000, and as has been the case for a while now, it was the lowest level for this week of the year in the past decade. On average, claims have typically been more than 50% higher than the current level during this week of the year.
the Bespoke 50 — 11/9/17
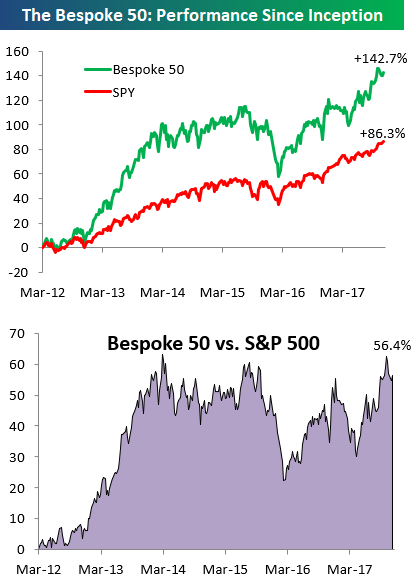
Every Thursday, Bespoke publishes its “Bespoke 50” list of top growth stocks in the Russell 3,000. Our “Bespoke 50” portfolio is made up of the 50 stocks that fit a proprietary growth screen that we created a number of years ago. Since inception in early 2012, the “Bespoke 50” has beaten the S&P 500 by 56.4 percentage points. Through today, the “Bespoke 50” is up 142.7% since inception versus the S&P 500’s gain of 86.3%. Always remember, though, that past performance is no guarantee of future returns.
To view our “Bespoke 50” list of top growth stocks, click the button below and start a trial to either Bespoke Premium or Bespoke Institutional.