Shorts Running From Bitcoin
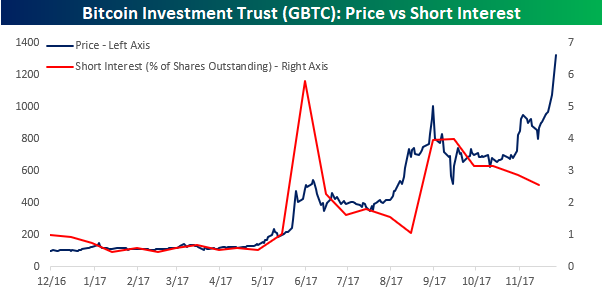
With so much skepticism being raised about crypto-currencies and bitcoin in particular, one would think that short interest in the investment trust that is meant to track bitcoin would be higher. However, based on the latest short interest figures released after the close last night, short interest in the Bitcoin Investment Trust (GBTC) has actually been on the decline during bitcoin’s most recent leg higher. Before reading too much into this data, we would note that GBTC is hardly a perfect method for tracking the performance of bitcoin. Over time, the security has traded at very wide premiums to its NAV. Also, the ETF is not very liquid, and because it doesn’t trade on any of the major exchanges, some firms do not allow clients to short it.
With all of those caveats in place, though, the chart below compares the price of GBTC over the last year to short interest in the ETF expressed as a percentage of total shares outstanding. During this period, short interest figures have generally tracked price pretty closely; when prices have increased, short interest rises and vice versa. Since the middle of October, though, we’ve seen short interest and price move in opposite directions. While the price of GBTC has doubled, short interest has declined from 3.2% of shares outstanding to 2.6%. Have investors who were brave enough (or foolish enough depending on your perspective) to short GBTC finally cried uncle, or are they just waiting to reload for when the trust reaches higher prices? We would note that back in August we saw a similar situation where short interest spiked just as GBTC first headed towards $1,000 ahead of what ended up being a short-term peak in price.
The Closer — Home Sales High, Record M&A — 11/27/17
Log-in here if you’re a member with access to the Closer.
Looking for deeper insight on markets? In tonight’s Closer sent to Bespoke Institutional clients, we discuss strong new home sales and the record level of US M&A.

The Closer is one of our most popular reports, and you can sign up for a free trial below to see it!
See today’s post-market Closer and everything else Bespoke publishes by starting a 14-day free trial to Bespoke Institutional today!
Cyber Monday – The Biggest Day for Online Retail
It may sound quaint today, but there was once a time when high-speed internet was not ubiquitous, and for many Americans, the only place to find a high-speed internet connection was at work. Due to the lack of high-speed internet access, Americans would head back to work after a long holiday weekend and start shopping. Hence, the term “Cyber Monday” entered the lexicon. Today, high-speed internet access is everywhere, so Cyber-Monday has become a bit of a relic, but don’t tell that to online retailers who will use any and all excuses to give consumers the impression that they are getting a bargain (Prime Day, anyone?).
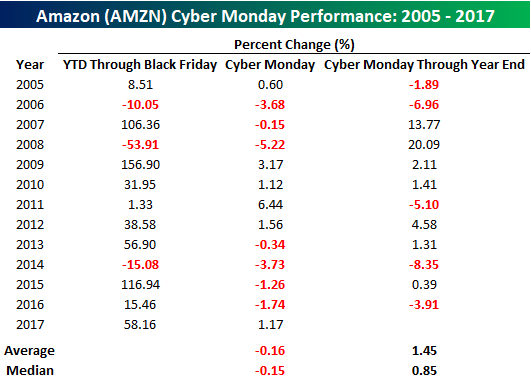
With all the attention still focused on Cyber-Monday by retailers, we wondered if it had any impact on the performance of online stocks like Amazon.com (AMZN). To that end, the table below lists the performance of AMZN’s stock on and after Cyber-Monday going back to 2005, which is when its Prime Service was first introduced. As shown in the table, Cyber-Monday has hardly been a catalyst for gains in AMZN’s stock price. Since 2005, the stock has seen an average decline of 0.16% on Cyber-Monday with gains in only six out of thirteen years. Furthermore, this year’s gain of 1.17% breaks a streak of four straight years where the stock was down on Cyber-Monday. In the period from Cyber-Monday through year-end, shares of AMZN have performed better on a historical basis. However, with an average gain of just 1.45% during a period where the overall market sees strength as well, the holiday shopping season hasn’t been particularly strong for AMZN.
So, if Cyber-Monday hasn’t been particularly strong for AMZN, what about the traditional retailers? In this case, performance is even worse. The table below shows the historical performance of the S&P Retail ETF (XRT) on and after Cyber-Monday since 2007 (historical data for the ETF doesn’t go back any further). In this case, the performance of retail stocks on Cyber Monday has been lousy. To highlight, if today’s modest gains in the ETF hold, it will be just the second time since 2007 that XRT has traded in the black on Cyber Monday. Overall, the ETF’s performance has been an average decline of 1.64% (median: -1.17%). For the remainder of the year, XRT has tended to recover a bit, but with an average gain of 0.89% (median: +0.70%), the group still underperforms the broader market during this period.
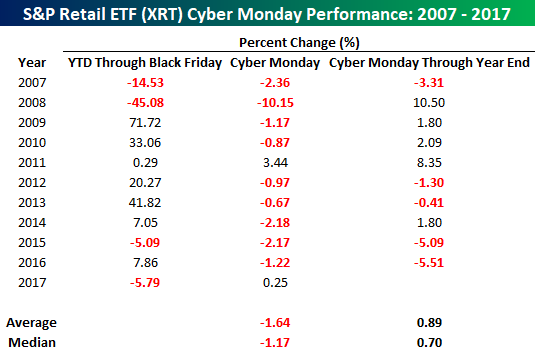
Chart of the Day: New Cycle Highs in New Home Sales
Bitcoin vs. Bitcoin Cash: Bitcoin’s Civil War
Bitcoin, once the only player in the cryptocurrency universe, is now facing competition that threatens to divide the entire crypto-community: Bitcoin Cash. Bitcoin began in 2009 with the promise of an easy, fast, and cheap method of transacting across borders. Lately, though, Bitcoin transactions have been anything but fast and cheap, with fees upwards of $6 per transaction. Some believe this is due to Bitcoin’s scaling issues finally manifesting themselves in the form of high fees. Others believe the spike in fees may have come from an attack on the network. While the truth is likely somewhere in the middle, a group of crypto developers finally had enough of the high fees and long confirmation times and decided to create a version of Bitcoin more aligned with the idea of an easily transact-able currency, rather than a digital store of value they felt Bitcoin had become.
Their vision became reality on August 1st, 2017, and the newly minted crypto adopted the name “Bitcoin Cash”. This new version of Bitcoin is almost identical to the old version, and anyone who owned Bitcoin prior to the August 1st creation date was credited with an equal amount of Bitcoin Cash. The primary difference between the two is that Bitcoin Cash has a higher cap on the maximum “block size”, allowing a larger daily throughput of transactions. The desired effect of the block size increase was to reduce fees and network congestion, which it appears to have accomplished. Here’s a chart showing average transaction fees for both Bitcoin and Bitcoin Cash.
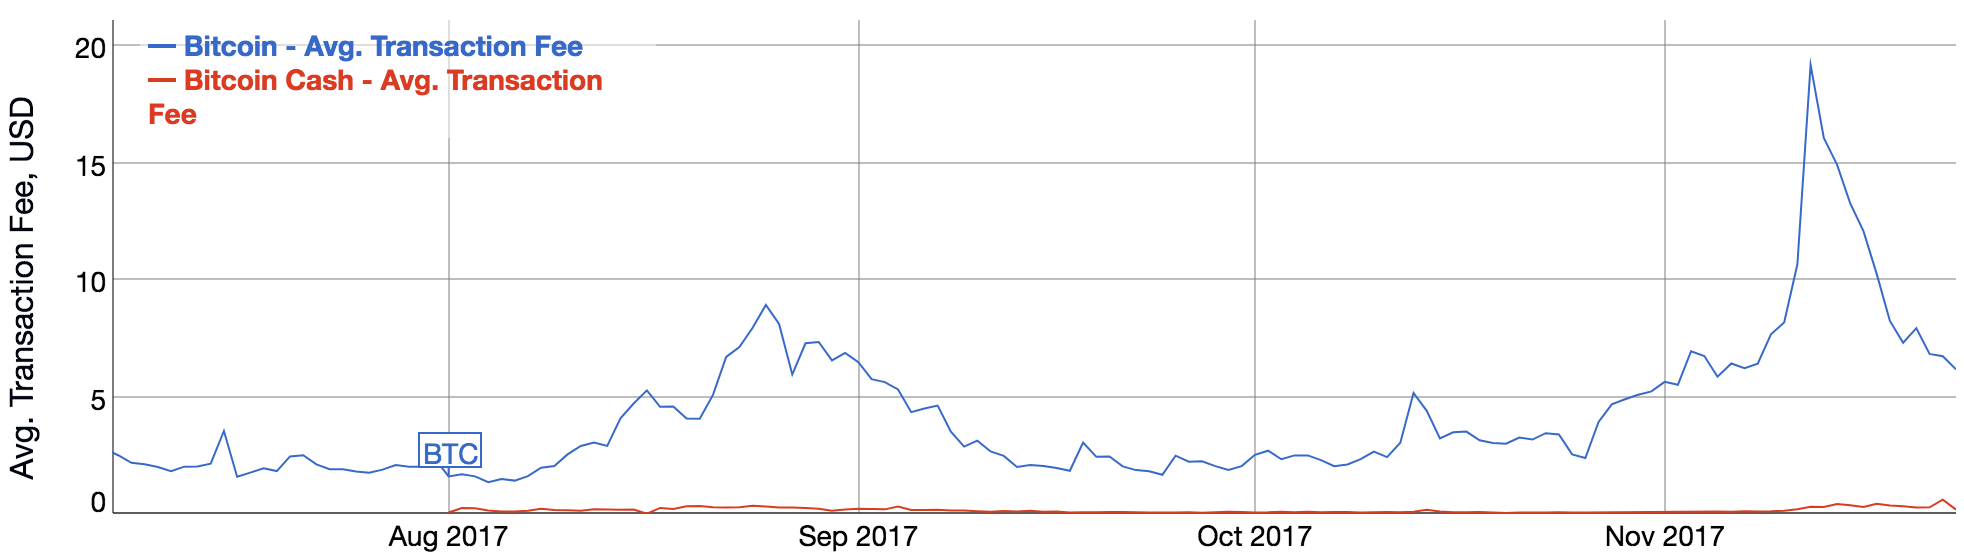
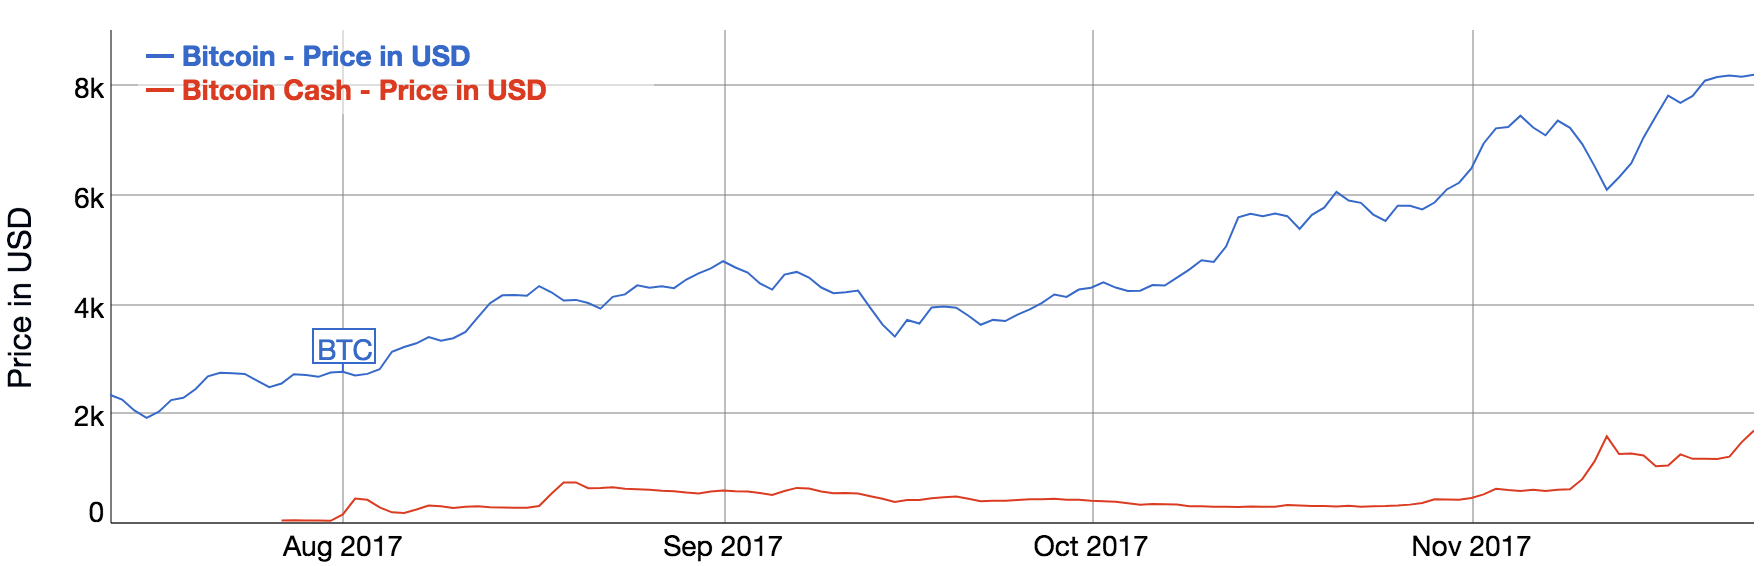
It’s immediately noticeable that there’s a significant difference in fees between the two currencies. As of 11/23/17, the average Bitcoin transaction fee clocks in at $6.18, while the average Bitcoin Cash transaction fee comes in at a measly 19 cents. At first, it would seem obvious that Bitcoin Cash is the superior solution. Lower fees, faster transactions, what’s not to love? The changes in Bitcoin price vs Bitcoin Cash price tell a similar story (see chart below).
However, a deeper look reveals that it’s too early to know if Bitcoin Cash can really make good on its promises. Both Bitcoin and Bitcoin Cash can only process a limited number of transactions per day. This limit is determined by two factors: the size of each block in the blockchain and the intervals at which blocks are produced. Both cryptocurrencies have the same interval: 1 block every 10 minutes, but Bitcoin Cash has a larger block size – up to 8 times the size of the original Bitcoin blocks. In theory, a bigger block means less competition to get your transaction included in a block, resulting in lower fees. But in practice, this is not yet the reason for Bitcoin Cash’s lower fees. First, let’s look at the number of transactions processed on each blockchain.
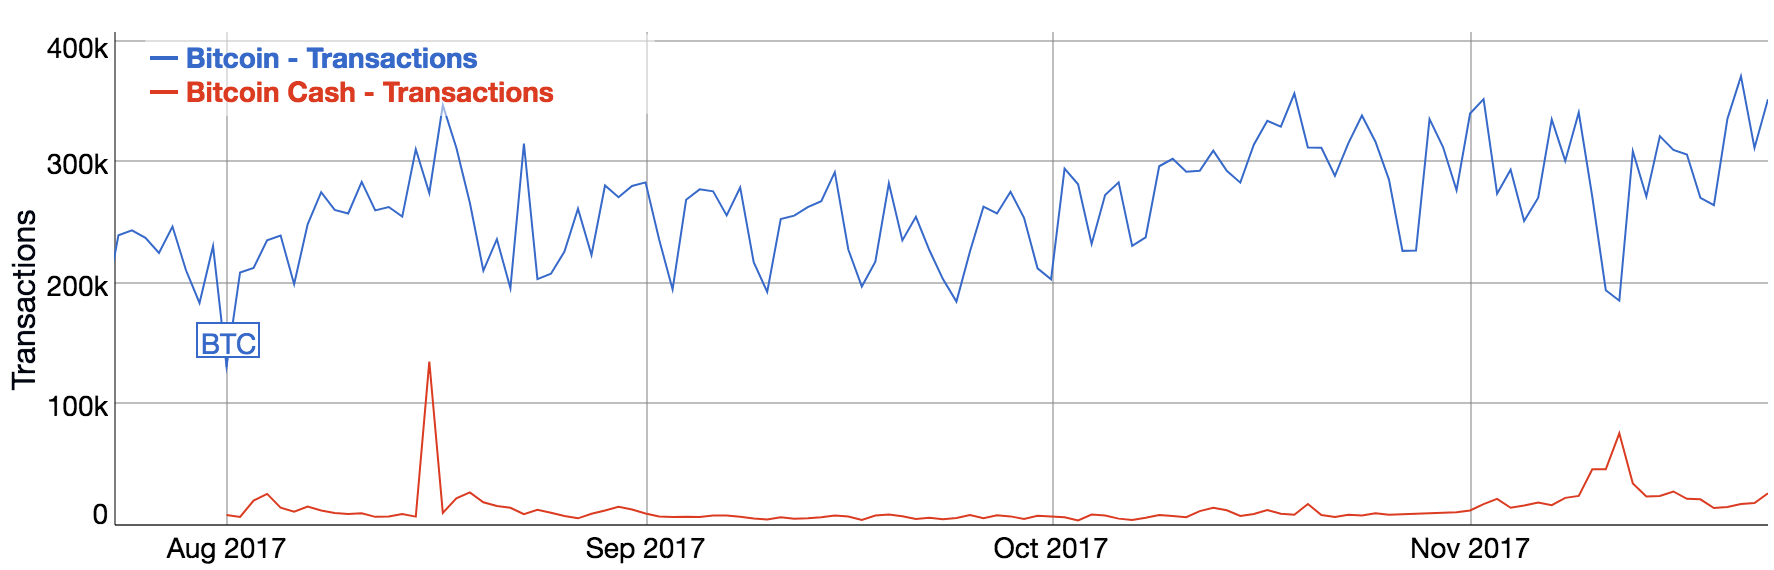
Bitcoin Cash processes less than 1/10th the number of transactions that Bitcoin does. The fees are lower not because of the increased block size, but because a comparatively small number of people are using the Bitcoin Cash blockchain. For reference, when Bitcoin was processing 30k transactions per day, a similar number of transactions that Bitcoin Cash processes now, the average transaction fee was less than a cent. While the increased block size may be an aid to the high fees, it may also have a “centralizing” effect, which could ultimately reduce the robustness and attack resistance of the network. The full effects of the block size increase will remain unknown until the Bitcoin Cash blockchain sees as many daily transactions as Bitcoin.
Charts and data sourced from https://bitinfocharts.com/.
Bespoke Stock Seasonality Report: 11/27/17
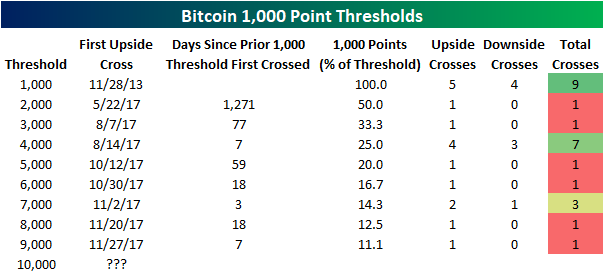
Bitcoin 1,000 Point Thresholds
So much for psychological resistance at round numbers. While a lot of fanfare is typically made when the Dow Jones Industrial Average crosses above a 1,000 point threshold for the first time, Bitcoin is tearing through 1,000 point intervals in warp speed. After finishing 2016 below $1,000, the most popular crypto-currency is currently knocking on the door of $10,000 and it’s not even December!
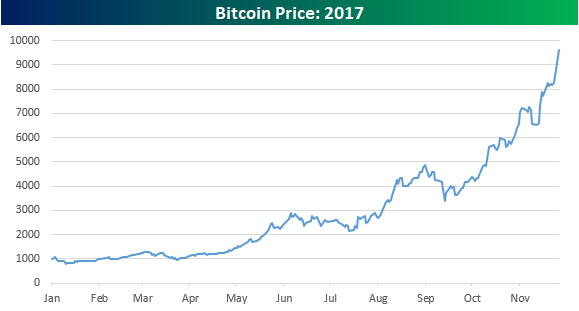
The table below lists the first time the price of Bitcoin has closed above each 1,000 point threshold. While the first cross of 1,000 took place way back in 2013, the first cross of every other 1,000 point interval has taken place in 2017. Not only that, but each of the crosses since 2,000 have taken place in the span of under three months. Even crazier is the fact that the crosses of 7K, 8K, and 9K have all taken place in November! Finally, with bitcoin currently trading above $9,600, all it needs is another 4% to break $10,000.
S&P 500 Quick-View Chartbook: 11/24/17
Bespoke’s Sector Snapshot — 11/24/17
We’ve just released our weekly Sector Snapshot report (see a sample here) for Bespoke Premium and Bespoke Institutional members. Please log-in here to view the report if you’re already a member. If you’re not yet a subscriber and would like to see the report, please start a two-week free trial to Bespoke Premium now.
Below is one of the many charts included in this week’s Sector Snapshot, which highlights the percentage of S&P 500 stocks currently trading above their 50-day moving averages. This is one breadth measure that isn’t quite as high as we’d like to see it given that the S&P 500 is trading at a new 52-week high.
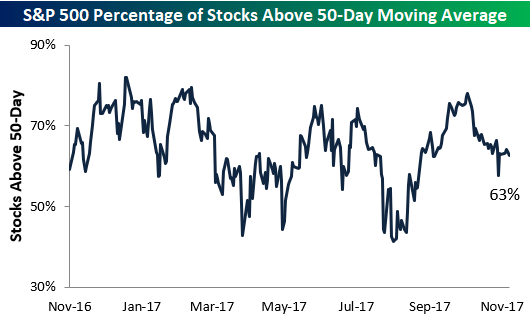
To see our full Sector Snapshot with additional commentary plus six pages of charts that include analysis of valuations, breadth, technicals, and relative strength, start a two-week free trial to our Bespoke Premium package now. Here’s a breakdown of the products you’ll receive.
Investors Rush Into Crypto
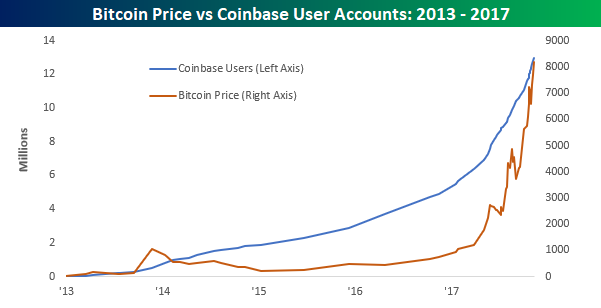
While a good deal of Americans opted to avoid talking politics around the Thanksgiving Dinner table this year, one topic filling the void was bitcoin. Whether it was a cousin bragging about buying it more than a year ago, or your uncle adamantly steadfast in his belief that the whole thing is a bubble, there’s a good chance someone mentioned it. With all the talk about bitcoin, a good deal of people are also starting to open accounts where they can buy and sell crypto-currencies. Coinbase is one of the largest platforms where consumers and merchants can transact in digital currencies like bitcoin and ethereum, and as bitcoin prices have surged, so too have the number of users on the platform. Just Wednesday, the company disclosed that the number of users on its platform had reached 13 million, but since then another 100,000 users have opened accounts!
To put this number of users into perspective, consider the fact that as of the end of 2016, Charles Schwab had 10.2 million brokerage accounts. Yes, Charles Schwab has a lot more assets in its accounts than Coinbase users, but the idea that crypto-currencies users are just a fringe part of the financial universe is not accurate.
The chart below shows the rate of change in bitcoin and the number of Coinbase users over the last four years (thanks to @alistairmilne for the user data). Not surprisingly, as prices have surged, so too have the number of accounts. In the last 12 months, as the price of bitcoin has increased more than ten-fold, the number of Coinbase users has increased from 4.9 million up to 13.1 million, for an increase of 167%.