the Bespoke 50 — 11/2/17
Every Thursday, Bespoke publishes its “Bespoke 50” list of top growth stocks in the Russell 3,000. Our “Bespoke 50” portfolio is made up of the 50 stocks that fit a proprietary growth screen that we created a number of years ago. Since inception in early 2012, the “Bespoke 50” has beaten the S&P 500 by 55.5 percentage points. Through today, the “Bespoke 50” is up 140.3% since inception versus the S&P 500’s gain of 84.6%. Always remember, though, that past performance is no guarantee of future returns.
To view our “Bespoke 50” list of top growth stocks, click the button below and start a trial to either Bespoke Premium or Bespoke Institutional.

Jobless Claims Down Again
Jobless claims were released earlier this morning and showed a larger than expected decline, falling from 234K down to 229K. Less than two months after three hurricanes ravaged different parts of the United States, jobless claims had their third lowest weekly print of the current expansion. The even more amazing aspect of the recent trends in jobless claims is that the lowest print of the cycle came two weeks ago! As things stand now, jobless claims have now been below 300K for 139 straight weeks.
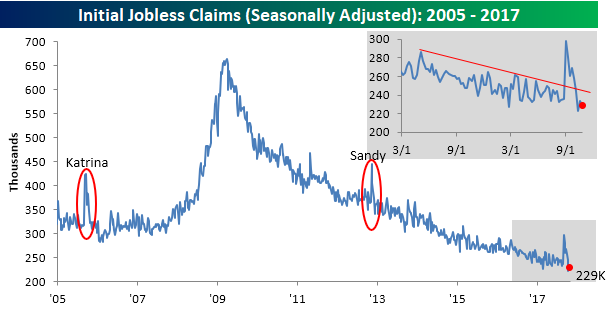
With such low prints in recent weeks, the four-week moving average for jobless claims fell to 232.5K, marking a new low for the current cycle. Not since 1973 has the four-week moving average been lower!

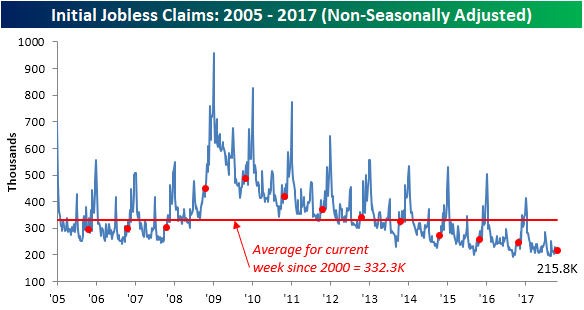
On a non-seasonally adjusted basis, jobless claims were pretty much unchanged at 215.8K from last week’s level of 215.7K. For the current week of the year, jobless claims are well more than 100K lower than their average for the current week of the year dating back to 2000 and haven’t been this low at this time of year since 1973.
The Closer — Households, Homes, & Wages — 11/1/17
Log-in here if you’re a member with access to the Closer.
Looking for deeper insight on global markets and economics? In tonight’s Closer sent to Bespoke Institutional clients, we take a look at auto sales in the US and across the rest of the Americas. We also review Mexican IMEF PMIs and weekly EIA data on the petroleum market.

The Closer is one of our most popular reports, and you can sign up for a free trial below to see it!
See today’s post-market Closer and everything else Bespoke publishes by starting a 14-day free trial to Bespoke Institutional today!
ETF Trends: US Indices & Styles – 11/1/17
Bespoke Consumer Pulse Report — November 2017
Bespoke’s Consumer Pulse Report is an analysis of a huge consumer survey that we run each month. Our goal with this survey is to track trends across the economic and financial landscape in the US. Using the results from our proprietary monthly survey, we dissect and analyze all of the data and publish the Consumer Pulse Report, which we sell access to on a subscription basis. Sign up for a 30-day free trial to our Bespoke Consumer Pulse subscription service here. With a trial, you’ll get coverage of consumer electronics, social media, streaming media, retail, autos, and much more. The report also has numerous proprietary US economic data points that are extremely timely and useful for investors.
Below we highlight one of the non-traditional economic indicators that we’re able to track with our monthly survey. We ask consumers if they’ve had any elective surgical visits or procedures in the last month. The thinking behind this question is that consumers typically have more elective surgeries like plastic surgery, Lasik, or orthopedic surgery when times are good, and they have less of them when times are lean. As shown in the chart, this reading has been ticking higher and higher throughout 2017, which is indicative of a strong, healthy economy.


Fixed Income Weekly – 11/1/17
Searching for ways to better understand the fixed income space or looking for actionable ideals in this asset class? Bespoke’s Fixed Income Weekly provides an update on rates and credit every Wednesday. We start off with a fresh piece of analysis driven by what’s in the headlines or driving the market in a given week. We then provide charts of how US Treasury futures and rates are trading, before moving on to a summary of recent fixed income ETF performance, short-term interest rates including money market funds, and a trade idea. We summarize changes and recent developments for a variety of yield curves (UST, bund, Eurodollar, US breakeven inflation and Bespoke’s Global Yield Curve) before finishing with a review of recent UST yield curve changes, spread changes for major credit products and international bonds, and 1 year return profiles for a cross section of the fixed income world.
In this week’s note, we investigate whether buy-and-hold strategies are useful on a risk-adjusted basis when trading UST futures.
Our Fixed Income Weekly helps investors stay on top of fixed income markets and gain new perspective on the developments in interest rates. You can sign up for a Bespoke research trial below to see this week’s report and everything else Bespoke publishes free for the next two weeks!
Click here and start a 14-day free trial to Bespoke Institutional to see our newest Fixed Income Weekly now!
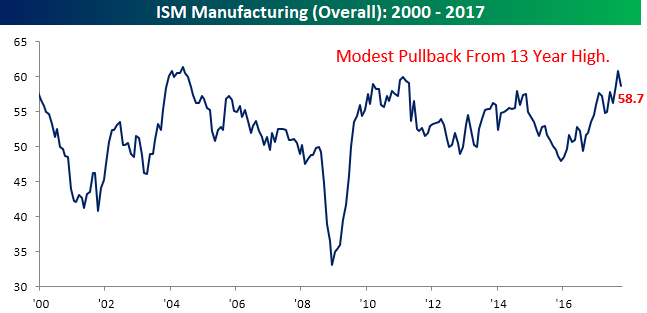
ISM Manufacturing Cools From a Hot September
Today’s release of the latest ISM Manufacturing report for the month of October came in weaker than expected as things cooled off slightly from a strong September. Looking at the commentary section of this month’s report, though, shows two distinct themes. First, the hurricanes really had a major impact on business operations around the country (yellow highlights). Second, business activity remains strong. Most of the selected comments all indicated that business is strong and accelerating.

While the commentary was strong, the headline index showed a slight decline, falling from last month’s 13-year high of 60.8 down to 58.7. While that represents a relatively large two-point decline, outside of the two prior monthly readings, it would have been the highest monthly print since April 2011!
Like the headline index, breadth in this month’s report was on the weak side in the short-term but still trending higher over the longer term. As shown in the table below, even as all but one of the report’s sub-components declined on a m/m basis, all but one was also up on a y/y over basis. The last time we saw weaker breadth on a m/m basis was in August 2016. Finally, looking ahead to this Friday’s jobs report, although the employment component of this month’s report was down m/m, it saw one of the smallest declines of any component and still remains high relative to history.
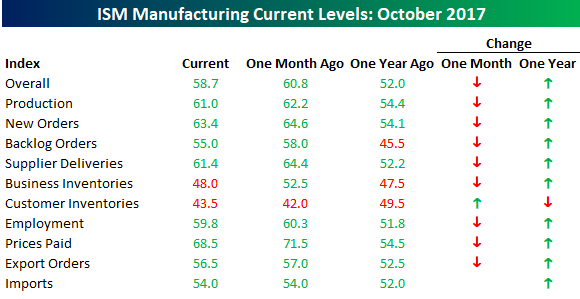
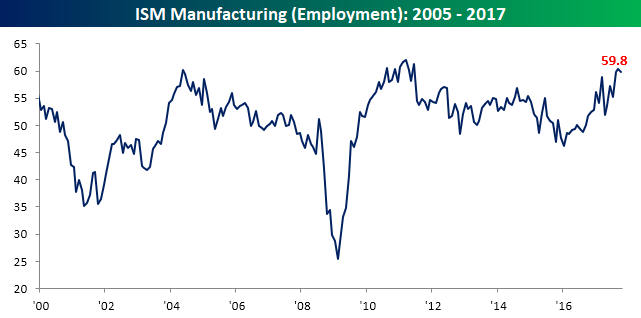
Chart of the Day: Strength Begets Strength
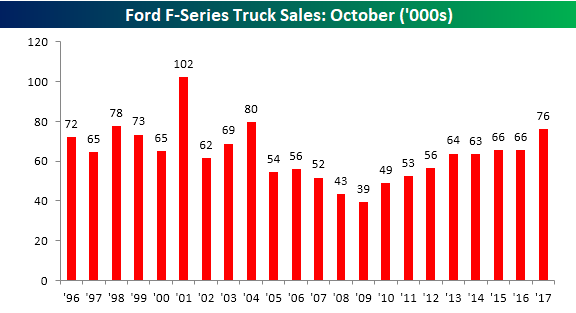
Ford Struck Sales Surge 16%
We like to track sales of pickup trucks (specifically at Ford) as they are often a sign of strength or weakness in the small business and construction sectors, and based on these numbers from Ford, the small business sector looks strong. For the month of October, Ford sold 75,974 F-Series trucks. That represents a y/y increase of 16% and is the strongest October sales figure for the company since 2004. Going back to 1996, the only three Octobers that were better than 2017 were 2001 (102K), 2004 (80K), and 1998 (78K). When comparing sales on a m/m basis, it isn’t always an apples to apples comparison because of differences in ‘selling’ days, but a 16% y/y increase is positive no matter how you look at it.
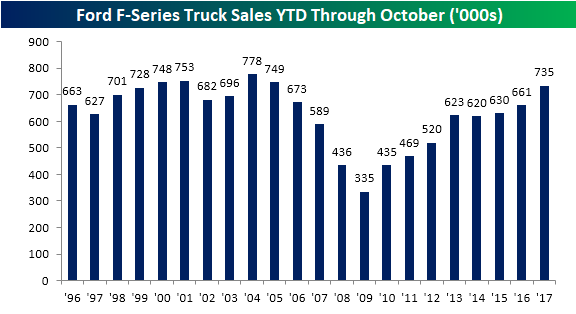
While differences in the number of selling days can skew results over the short-term when comparing figures on a YTD basis, unadjusted numbers provide more of an apples to apples comparison, and here again, Ford’s results for 2017 continue to be very strong. Through the end of October, total sales of F-Series trucks have been 734,610. That represents an increase of 11.1% and is the best YTD reading for the first ten months of the year since 2005.
Bespoke’s Global Macro Dashboard — 11/1/17
Bespoke’s Global Macro Dashboard is a high-level summary of 22 major economies from around the world. For each country, we provide charts of local equity market prices, relative performance versus global equities, price to earnings ratios, dividend yields, economic growth, unemployment, retail sales and industrial production growth, inflation, money supply, spot FX performance versus the dollar, policy rate, and ten year local government bond yield interest rates. The report is intended as a tool for both reference and idea generation. It’s clients’ first stop for basic background info on how a given economy is performing, and what issues are driving the narrative for that economy. The dashboard helps you get up to speed on and keep track of the basics for the most important economies around the world, informing starting points for further research and risk management. It’s published weekly every Wednesday at the Bespoke Institutional membership level.
You can access our Global Macro Dashboard by starting a 14-day free trial to Bespoke Institutional now!
