The Closer — Hello 2018! — 1/2/18
Log-in here if you’re a member with access to the Closer.
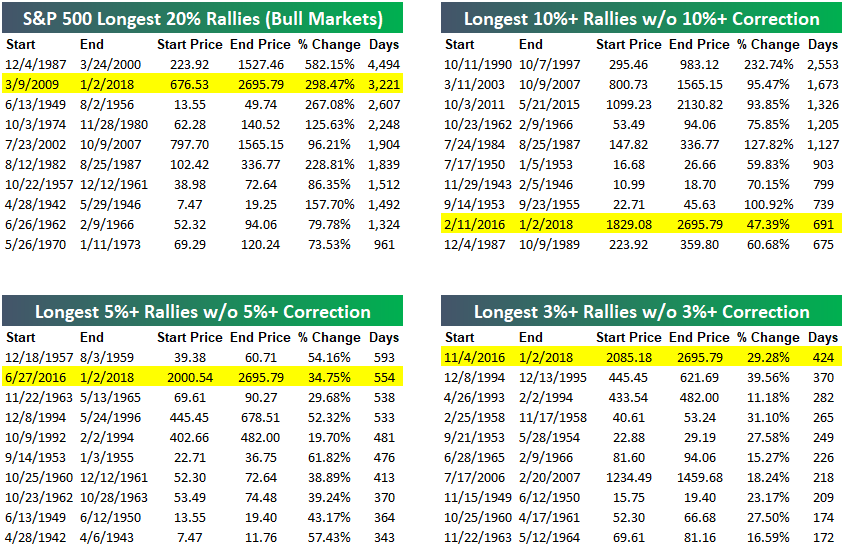
Looking for deeper insight on markets? In tonight’s Closer sent to Bespoke Institutional clients, we review the strong start to 2018 for stocks. The S&P 500 made a brand new all-time closing high today, and below we update our table showing the longest rallies for the index without experiencing a 20%, 10%, 5%, or 3% pullback. The current streak of 424 days without just a 3% pullback is easily the longest on record at this point, which is absolutely amazing.
See today’s post-market Closer and everything else Bespoke publishes by starting a 14-day free trial to Bespoke Institutional today!
Chart of the Day: It’s Cold
Bespoke Consumer Pulse Report — January 2018
Bespoke’s Consumer Pulse Report is an analysis of a huge consumer survey that we run each month. Our goal with this survey is to track trends across the economic and financial landscape in the US. Using the results from our proprietary monthly survey, we dissect and analyze all of the data and publish the Consumer Pulse Report, which we sell access to on a subscription basis. Sign up for a 30-day free trial to our Bespoke Consumer Pulse subscription service. With a trial, you’ll get coverage of consumer electronics, social media, streaming media, retail, autos, and much more. The report also has numerous proprietary US economic data points that are extremely timely and useful for investors.

S&P 500 Stock Seasonality – 1/2/18
While we don’t ever suggest that investors should base their trading solely on the calendar, there is evidence that the market and many stocks do indeed follow seasonal patterns. This makes our S&P 500 Stock Seasonality report a useful addition to every investor’s toolbox. Using the last ten years worth of price data, our Stock Seasonality report looks at the average returns for the S&P 500, its eleven sectors, and its 500 individual stocks. In the report, we highlight the five stocks in each sector that have historically been the best and worst performers over the next two weeks. For each stock, we also include information such as average returns, the percent of time each stock or sector is positive/outperforms the S&P 500, and its historical performance over the next two weeks for each of the last ten years. The Stock Seasonality report is published on a weekly basis on Mondays, and it is available to all Bespoke Premium and Bespoke Institutional subscribers.
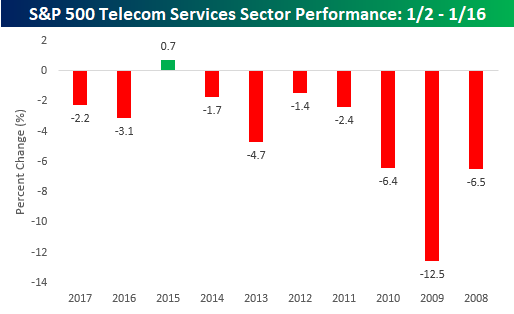
One sector that we wanted to highlight this week is Telecom Services. The table below shows the sector’s historical performance from the close on 1/2 through the close on 1/16 (when either of those two days occurs on a day the market is closed, we use the most recent closing price) over the last ten years. As shown, the upcoming two week period hasn’t been a good one for the sector. While it currently consists of just three stocks (AT&T- T, CenturyLink- CTL, and Verizon-VZ), the trend has been consistently lower. Over the last ten years, the sector’s median performance during this period has been a decline of 2.74% with declines in nine out of ten periods. The only year that the sector was up during this period was in 2015 and the gain was less than 1%,
For active traders, our Stock Seasonality report is an excellent tool to help keep track of the best and worst times of year for the overall market, sectors, and individual stocks. To see the report, sign up for a monthly Bespoke Premium membership now!
Bespoke Brunch Reads: 12/31/17
Welcome to Bespoke Brunch Reads — a linkfest of the favorite things we read over the past week. The links are mostly market related, but there are some other interesting subjects covered as well. We hope you enjoy the food for thought as a supplement to the research we provide you during the week.
The Big Apple
The Most Expensive Mile of Subway Track on Earth by Brian M. Rosenthal (NYT)
Massive cost inflation on capital projects related to New York City transit is driven more by rampant fraud and excess than the admittedly significant challenges inherent to construction in the dense urban environment. [Link; soft paywall]
Crime in New York City Plunges to a Level Not Seen Since the 1950s by Ashley Southall (NYT)
Murders in the country’s largest city have fallen by nearly 90% since 1990 and are at a record low for periods with reliable data. The decline has been consistent for 27 years straight. [Link; soft paywall]
Biology
Crispr Isn’t Enough Any More. Get Ready For Gene Editing 2.0 by Megan Molteni (Wired)
5000 papers in 5 years have mentioned Crispr, the gene editing protocol discovered in 2012. Here’s a rundown of the next wave of techniques that will be used for gene editing. [Link; auto-playing video]
As World Eats More Meat, U.S. Soy Is Losing the Battle to Feed Animals by Jeff Wilson and Tatiana Freitas (Bloomberg)
The US soybean crop’s protein yield fell to 34.1% this year, a tie with 2008 for the lowest since at least 1986, putting US farmers at a disadvantage when it comes to international sales of the harvest. [Link]
Tech
Freed From the iPhone, the Apple Watch Finds a Medical Purpose by Daisuke Wakabayashi (NYT)
With the ability to receive data connections thanks to wireless transmitting capability, the Apple Watch is starting to fulfill the medical promise of the device. [Link, soft paywall]
Blockchain Pumping New Life Into Old-School Companies Like IBM by Olga Kharif (Bloomberg)
If the hype around the adoption of blockchain technology for a myriad of roles is to be believed, IBM is in an excellent position to benefit. [Link; auto-playing video]
Emerging Markets
Emerging Markets: Growing in Maturity? by Richard Barley (WSJ)
The MSCI EM stock index turned 30 this week, and over those three decades lots has changed. Now, with constituent countries at 35% of the global economy, the index looks totally different from its origins. [Link; paywall]
Economics
Ten Economic Questions for 2018 by Bill McBride (Calculated Risk)
Bill’s always excellent blog always features this annual outlook piece which sits the stage for the coming year of data. [Link]
Best Schematic Ever: Financial Frictions in Macro/Finance by Menzie Chinn (Econbrowser)
An amazing run-down of literature that details the frictions in financial and real markets which can inhibit efficiency and curtails the benefits of the construct. [Link]
Banking
Goodbye, George Bailey: Decline of Rural Lending Crimps Small-Town Business by Ruth Simon and Coulter Jones (WSJ)
Almost one-third of local rural counties have no local bank, versus less than 15% in the mid-1990s. The trend is part of a larger wave of consolidation in banking across the economy but is crimping rural communities to an especially large degree. [Link; paywall]
Long Reads
Minecraft (Alice Maz)
A fascinating read on the economy of a Minecraft server, with remarkable similarities and differences to and from the real-world version. [Link]
The Secret History Of The Russian Consulate In San Francisco by Zach Dorfman (Foreign Policy)
An almost impossible to believe story of soft espionage conducted against Silicon Valley and the US more generally from the foggy hills of San Francisco. [Link; soft paywall]
Have a great Sunday and a Happy New Year!
The Closer: End of Week Charts — 12/29/17
Looking for deeper insight on global markets and economics? In tonight’s Closer sent to Bespoke clients, we recap weekly price action in major asset classes, update economic surprise index data for major economies, chart the weekly Commitment of Traders report from the CFTC, and provide our normal nightly update on ETF performance, volume and price movers, and the Bespoke Market Timing Model. This week, we’ve added a section that helps break down momentum in developed market foreign exchange crosses.

The Closer is one of our most popular reports, and you can sign up for a free trial below to see it!
See tonight’s Closer by starting a two-week free trial to Bespoke Institutional now!
Best and Worst Performing S&P 500 Stocks in 2017
While the cap-weighted S&P 500 gained 19.42% on the year, the average stock in the index was up less than that at just over 18%.
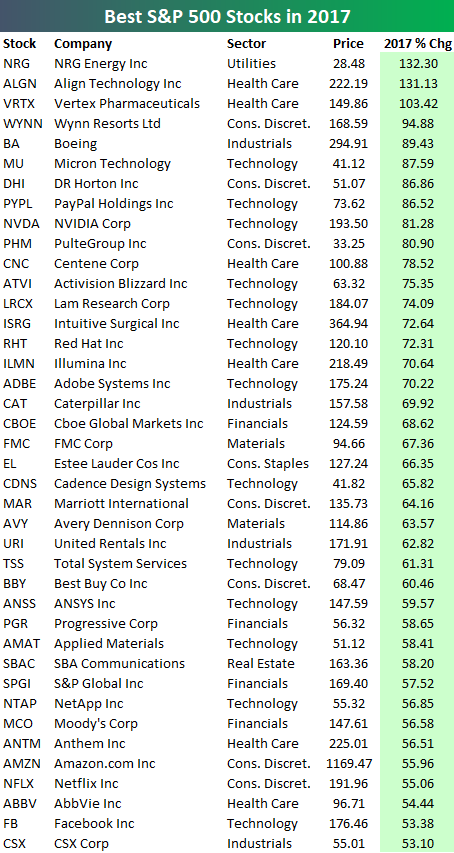
There were exactly 50 stocks in the S&P that gained more than 50% on the year, and there were only 3 that gained more than 100%. We were a bit surprised that only 3 stocks posted triple-digit returns given the year that markets had. We were even more surprised to see a Utilities stock at the top of the best performers list! That’s right — NRG Energy (NRG) was the top performing stock in the S&P 500 in 2017 with a gain of 132.3%. The other two triple-digit gainers were Align Tech (ALGN), and Vertex Pharma (VRTX). Wynn Resorts (WYNN) and Boeing (BA) rounded out the top five with gains of 94.88% and 89.43%, respectively.
Other notables on the list of S&P 500 winners include NVIDIA (NVDA), Activision Blizzard (ATVI), Adobe (ADBE), Caterpillar (CAT), Best Buy (BBY), Amazon (AMZN), Netflix (NFLX), and Facebook (FB). All of these names gained more than 50% in 2017.
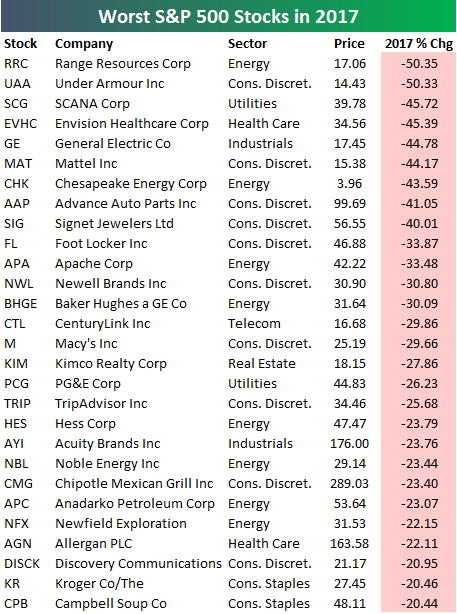
It’s tough in any year to be on the loser’s list, but it’s even tougher in a year when the S&P gains as much as it did this year. Below is a list of the S&P 500 stocks that fell more than 20% in 2017. Range Resources (RRC) and Under Armour (UAA) top the list with declines of 50%+. General Electric (GE) is by far the most high-profile name on the list of losers with a huge drop of 44.78%. Other notable losers include Mattel (MAT), Macy’s (M), Baker Hughes (BHGE), Foot Locker (FL), TripAdvisor (TRIP), Chipotle (CMG), and Campbell Soup (CPB).
2017 Asset Class Total Return Performance
Below are the final total return numbers in 2017 for various asset classes using our key ETF matrix. Use our Trend Analyzer tool to monitor our proprietary Trend and Timing ratings for each of the ETFs shown (plus every stock in the S&P 500, Dow 30, and Nasdaq 100).
While the Nasdaq 100 (QQQ) was the worst performing asset class in the final week of the year, it finished 2017 with a total return of 32.66%. That’s the biggest gainer of the US index ETFs we track.
The S&P 500 Growth ETF (IVW) easily outperformed all other growth and value ETFs across large caps, mid caps, and small caps. From a sector perspective, Tech (XLK) gained the most in 2017 followed by Materials (XLB) and Industrials (XLI). Energy (XLE) and Telecom (IYZ) both finished the year in the red.
Outside of the US, India (PIN), Hong Kong (EWH), and China (ASHR) were up the most in 2017, while Russia (RSX) was up the least. Emerging markets (EEM) had an excellent year with a gain of 37.28%. Natural gas (UNG), on the other hand, had a brutal year with a decline of 37.58%.
Finally, fixed income ETFs all posted single-digit positive returns, with TLT gaining the most at +9.18%.
Happy New Year and best of luck in 2018!
