While we don’t ever suggest that investors should base their trading solely on the calendar, there is evidence that the market and many stocks do indeed follow seasonal patterns. This makes our S&P 500 Stock Seasonality report a useful addition to every investor’s toolbox. Using the last ten years worth of price data, our Stock Seasonality report looks at the average returns for the S&P 500, its eleven sectors, and its 500 individual stocks. In the report, we highlight the five stocks in each sector that have historically been the best and worst performers over the next two weeks. For each stock, we also include information such as average returns, the percent of time each stock or sector is positive/outperforms the S&P 500, and its historical performance over the next two weeks for each of the last ten years. The Stock Seasonality report is published on a weekly basis on Mondays, and it is available to all Bespoke Premium and Bespoke Institutional subscribers.
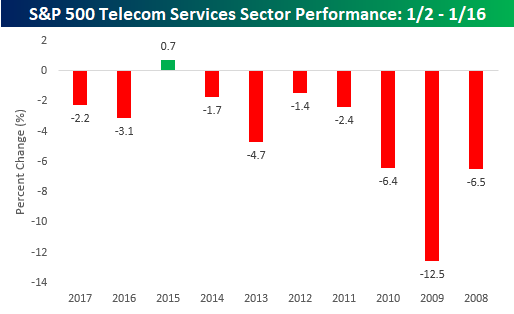
One sector that we wanted to highlight this week is Telecom Services. The table below shows the sector’s historical performance from the close on 1/2 through the close on 1/16 (when either of those two days occurs on a day the market is closed, we use the most recent closing price) over the last ten years. As shown, the upcoming two week period hasn’t been a good one for the sector. While it currently consists of just three stocks (AT&T- T, CenturyLink- CTL, and Verizon-VZ), the trend has been consistently lower. Over the last ten years, the sector’s median performance during this period has been a decline of 2.74% with declines in nine out of ten periods. The only year that the sector was up during this period was in 2015 and the gain was less than 1%,
For active traders, our Stock Seasonality report is an excellent tool to help keep track of the best and worst times of year for the overall market, sectors, and individual stocks. To see the report, sign up for a monthly Bespoke Premium membership now!
