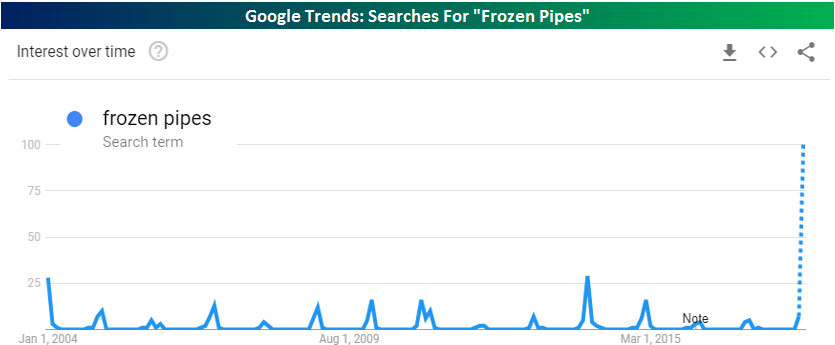
Plumbers Rejoice!
We all know it’s frigid across much of the US, but the chart below really says it all. As shown by the latest data on Google Trends, searches for the term “Frozen Pipes” are at the highest level on record. That statement doesn’t even do the current spike in search results justice, though. Based on the latest results, searches for “Frozen Pipes” are on pace to be nearly four times greater than they were at the previous record highs in early 2004 and early 2014. Incredible. It’s going to be a busy few weeks for plumbers and insurance adjusters!
The Bespoke Report – New Year, Same Gear
The Closer: End of Week Charts — 1/5/18
Looking for deeper insight on global markets and economics? In tonight’s Closer sent to Bespoke clients, we recap weekly price action in major asset classes, update economic surprise index data for major economies, chart the weekly Commitment of Traders report from the CFTC, and provide our normal nightly update on ETF performance, volume and price movers, and the Bespoke Market Timing Model. This week, we’ve added a section that helps break down momentum in developed market foreign exchange crosses.

The Closer is one of our most popular reports, and you can sign up for a free trial below to see it!
See tonight’s Closer by starting a two-week free trial to Bespoke Institutional now!
B.I.G. Tips – Death by Amazon – 1/5/18
International Markets Lead US to Start 2018
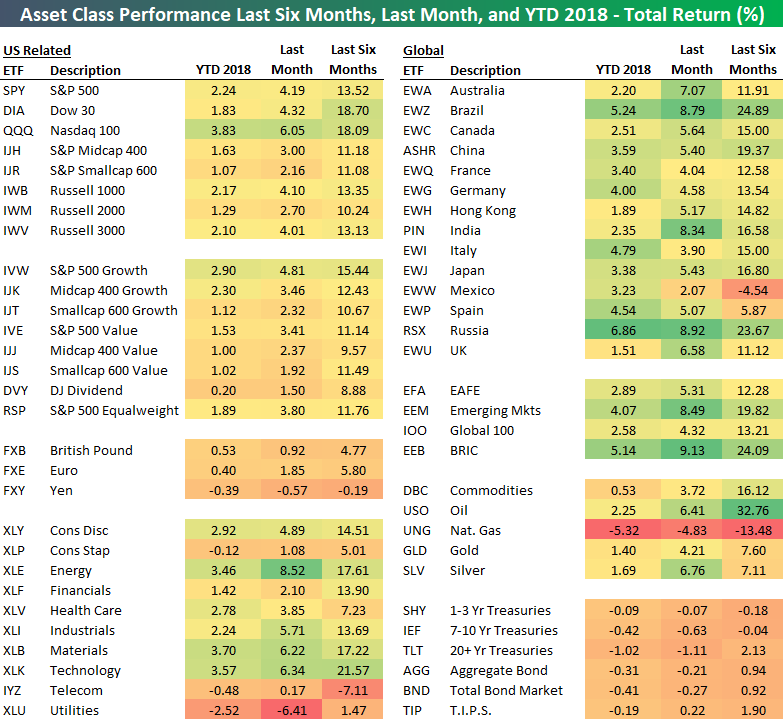
Below is a look at our asset class performance matrix highlighting the total return of various ETFs over three near-term time frames — over the last six months, over the last month, and year-to-date so far in 2018.
Notably, the oil ETF (USO) is now up more than any asset class in our matrix over the last six months with a gain of 32.76%. Behind oil is Brazil (EWZ), the BRIC ETF (EEB), Russia (RSX), and the S&P 500 Technology sector (XLK). Natural gas (UNG), Mexico (EWW), and the Telecom sector (IYZ) are down the most over the last six months.
In terms of performance to kick off 2018, US equities have done very well out of the gate with the S&P 500 gaining 2.24% this week. The Nasdaq 100 (QQQ) has done even better with a gain of 3.83%, while the Dow 30 (DIA) has lagged at +1.83%. Large-caps have outperformed small-caps thus far, and growth has outperformed value.
While US equities have yet to see a down day in 2018, international markets have posted even bigger gains to start the year. Russia (RSX), Brazil (EWZ), Italy (EWI), Spain (EWP), and Germany (EWG) are all up more than 4% on the year already, and the emerging markets ETF (EEM) is up 4.07%.
One asset class that has dipped to start 2018 is fixed income, where both short and long-term Treasury ETFs are down.
S&P 500 Quick-View Chart Book — 1/5/18
Bespoke’s List of the Most Volatile Stocks on Earnings
The Q4 2017 earnings reporting period starts up next week, and as we do prior to every earnings season, in this post we provide lists of the stocks that have historically been the most volatile on their earnings reaction days.
If you follow markets at all, you know that stocks see their biggest price moves in reaction to their quarterly earnings reports. Since this is the case, to us at least, it’s very important to know how stocks typically react to their quarterly reports. To keep track of these price moves, we maintain a huge database called our Earnings Screener that contains every quarterly earnings report for US stocks going back to 2001. There are roughly 150,000 individual quarterly reports in the database at this point, and every quarter we add to the list — giving us an even more comprehensive data set to analyze.
Users of our Earnings Screener can search for historical reports on a stock by stock basis, or they can run searches to find, for example, a list of stocks that have beaten EPS estimates, beaten revenue estimates, and raised guidance over a specific time frame. The capabilities of the database are pretty limitless, so give it a try by starting a 14-day free trial to Bespoke Institutional. It’s only available at the Bespoke Institutional membership level. You can see a video tutorial of how to use the database here.
From our Earnings Screener, we pulled every quarterly report since 2001 to find the average volatility of stocks on their earnings reaction days by sector. (For stocks that report in the AM before the open, its earnings reaction day is that trading day. For stocks that report in the evening after the close, its earnings reaction day is the next trading day.)
As shown, the average one-day price change in reaction to earnings for all stocks in our database has historically been +/-5.34%. So investors can basically expect any given stock to move roughly 5% up or down when it reports earnings every quarter.
Some sectors see much more volatility on earnings than others, though, and you can probably imagine which sectors are most and least volatile. As shown, Technology sector stocks are the most volatile on earnings, with an average one-day price change of +/-7.15%. Consumer Discretionary, Health Care, and Industrials are the three additional sectors that see their stocks move more than the market average on their earnings reaction days.
On the flip side, Utilities and Real Estate (REITs) stocks are the least volatile in reaction to earnings. The average REIT moves just +/-2.51% on its earnings reaction day each quarter, while the average Utilities stock moves even less at just +/-2.26%.

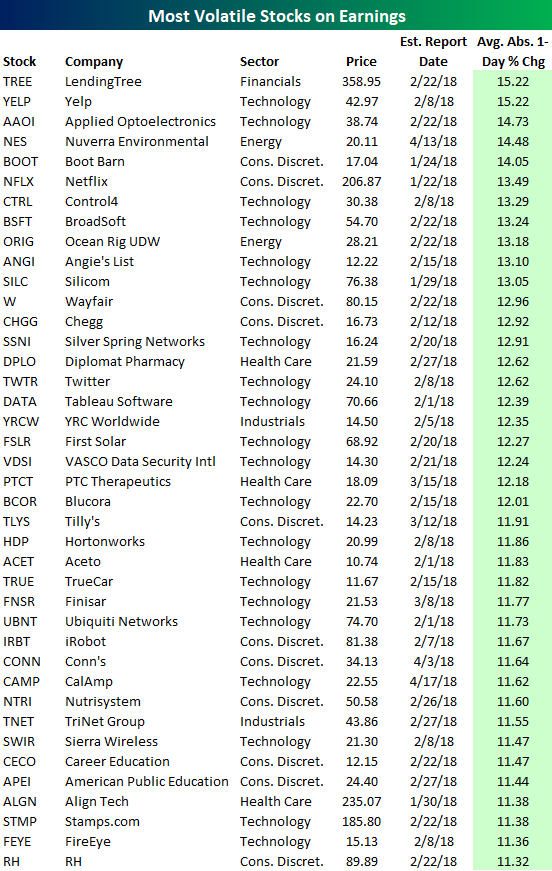
Below is our updated list of the individual stocks that see the biggest moves on their earnings reaction days. If you’re looking for volatility during earnings season, this is the place to start.
To make the list, a stock must have at least 3 years (12 quarters) worth of earnings reports, and it must currently trade above $10/share.
As show, LendingTree (TREE) ranks as the most volatile stock on earnings with an average move of +/-15.22% on its earnings reaction day. As a $358 stock, that means you can expect a move up or down of $53/share when it reports on 2/22 if it just experiences an average move.
Just behind TREE is YELP in second place with an average move of +/-15.22% on earnings. Behind Yelp is AAOI, NES, and BOOT. The top five most volatile stocks on earnings all move more than +/-14% when they report once per quarter.
While you may not be familiar with the five most volatile stocks on earnings, you surely know Netflix (NFLX) in sixth place. As shown, Netflix — which reports after the close on 1/22 — has historically moved +/-13.49% on its earnings reaction days. That’s roughly $27 per quarter at its current share price.
Other notables on the list include stocks like Twitter (TWTR), First Solar (FSLR), iRobot (IRBT), Nutrisystem (NTRI), Wayfair (W), Tableau Software (DATA), and Align Tech (ALGN).
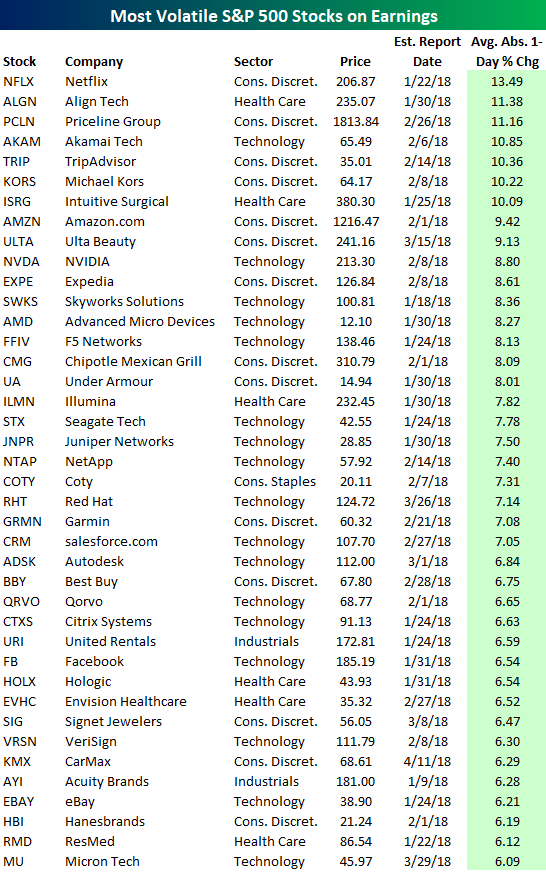
Below we highlight the most volatile S&P 500 stocks on earnings. In the table above, NFLX and ALGN were the only S&P 500 names to make the list. In the S&P 500 specifically, along with NFLX and ALGN, the three stocks that round out the top five are Priceline (PCLN), Akamai Tech (AKAM), and TripAdvisor (TRIP). Each of these stocks along with two more — KORS and ISRG — historically move more than +/-10% on their earnings reaction days. Amazon.com (AMZN) — one of five largest companies in the world — just barely misses the 10% mark with an average move of +/-9.42% on earnings. Other notables on the list of big S&P 500 earnings movers include NVIDIA (NVDA), Ulta Beauty (ULTA), Chipotle (CMG), Under Armour (UA), salesforce.com (CRM), Best Buy (BBY), and Facebook (FB).
All of the stocks listed in the table above and the table below are worth keeping an eye on this earnings season. While it’s impossible to know whether they’ll trade up or down (although many have historically averaged big gains), you can rest assured that they’ll experience big moves.
Bespoke’s Sector Snapshot — 1/4/18
We’ve just released our weekly Sector Snapshot report (see a sample here) for Bespoke Premium and Bespoke Institutional members. Please log-in here to view the report if you’re already a member. If you’re not yet a subscriber and would like to see the report, please start a two-week free trial to Bespoke Premium now.
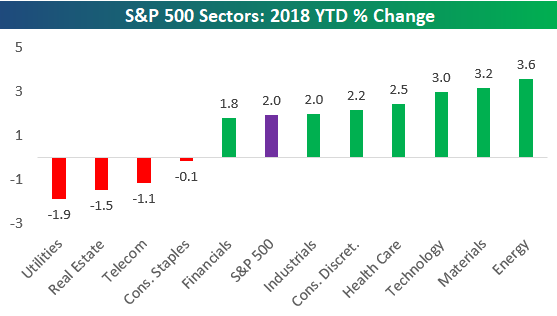
Below is one of the many charts included in this week’s Sector Snapshot, which highlights the year-to-date percentage change of the S&P 500 and its eleven sectors. As shown, Energy, Materials, and Technology are already up 3%+ in 2018 and the year is just 3 trading days old!
To see our full Sector Snapshot with additional commentary plus six pages of charts that include analysis of valuations, breadth, technicals, and relative strength, start a two-week free trial to our Bespoke Premium package now. Here’s a breakdown of the products you’ll receive.
The Closer — Crude Crunch — 1/4/18
Log-in here if you’re a member with access to the Closer.
Looking for deeper insight on markets? In tonight’s Closer sent to Bespoke Institutional clients, we take a look at changing dynamics in the crude curve as well as recapping today’s EIA data.

See today’s post-market Closer and everything else Bespoke publishes by starting a 14-day free trial to Bespoke Institutional today!
S&P 500 P/E Ratio Approaching 23
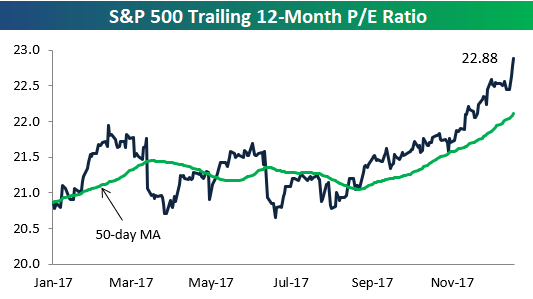
As the S&P 500 climbs higher and higher, its trailing 12-month P/E ratio continues to climb as well. And there won’t be much opportunity for multiple compression until the bulk of S&P 500 companies report Q4 numbers in late January.
As shown below, the S&P’s 12-month P/E is now at 22.88 — just a hair below 23.
Below is a chart showing the S&P’s P/E ratio going back to 1980. The line is red when the P/E ratio is above the level it’s at right now. As you can see, there have only been a few periods over the last 35+ years where the index’s P/E was higher. It didn’t once get above this level during the 2002-2007 bull market, but it was consistently above 23 during the final three years of the bull market that ended in early 2000. From 1998 to 2000, the S&P’s P/E expanded from 23 up to 30+ as the Dot Com bubble reached its zenith. Over this period, the S&P experienced a massive rally as the Tech sector soared. While valuations are indeed elevated right now, we always note that high valuations alone are not a catalyst for corrections or bear markets.
