Bespoke Stock Scores — 1/9/18
Bespoke CNBC Appearance (1/9)
Bespoke co-founder Paul Hickey appeared on CNBC’s Squawk Box earlier today to discuss markets and the new year. To view the clip please click on the image below.

The Closer — Valuation Check-Up, Markets Behind Fed’s Curve, Consumer Credit — 1/8/18
Log-in here if you’re a member with access to the Closer.
Looking for deeper insight on markets? In tonight’s Closer sent to Bespoke Institutional clients, we review small and large cap valuations, the markets’ accuracy forecasting the Fed’s rate actions, monthly consumer credit data, and our new Trend Analyzer tool.

See today’s post-market Closer and everything else Bespoke publishes by starting a 14-day free trial to Bespoke Institutional today!
US Market Cap Approaches $30 Trillion
The market cap of the Russell 3,000, which contains roughly 98.5% of US stock market cap, is currently at $29.99 trillion.
Below is a chart showing the historical market cap of the Russell 3,000 since Bush II officially won the 2000 election on December 12th, 2000. As shown, the index’s market cap ended up falling $3.31 trillion under Bush II due to the Financial Crisis at the end of his 2nd term. Stock market cap grew by $12.33 trillion from the time Obama was elected in November 2008 through November 2016. And finally, US stocks have increased by $6.26 trillion in market cap since Trump won the Presidency on November 8th, 2016.
From the low point of the Financial Crisis on March 9th, 2009, US stock market cap has grown from $7.6 trillion up to $29.99 trillion — easily the biggest creation of stock market wealth in history.
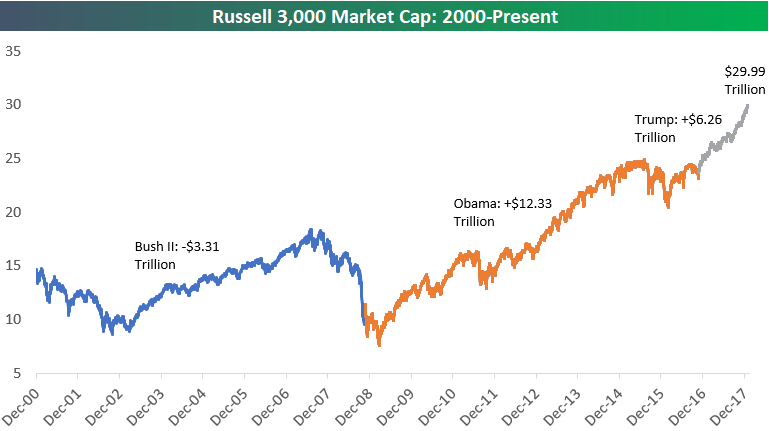
Chart of the Day: Analyst Sentiment Surges
Bespoke S&P 500 Sector Weightings Report — January 2018
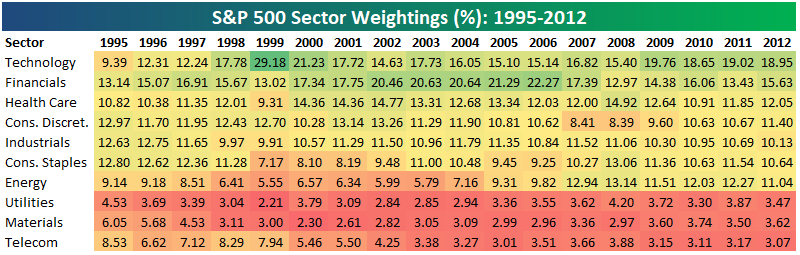
S&P 500 sector weightings are important to monitor. Over the years when weightings have gotten extremely lopsided for one or two sectors, it hasn’t ended well. Below is a table showing S&P 500 sector weightings from the mid-1990s through 2012. In the early 1990s before the Dot Com bubble, the US economy was much more evenly weighted between manufacturing sectors and service sectors. Sector weightings were bunched together between 6% and 14% across the board. In 1990, Tech was tied for the smallest sector of the market at 6.3%, while Industrials was the largest at 14.7%. The spread between the largest and smallest sectors back then was just over 8 percentage points.
The Dot Com bubble completely blew up the balanced economy, and looking back you can clearly see how lopsided things had become. Once the Tech bubble burst, it was the Financial sector that began its charge towards dominance. The Financial sector’s sole purpose is to service the economy, so in our view you never want to see the Financial sector make up the largest portion of the economy. That was the case from 2002 to 2007, though, and we all know how that ended.
Unfortunately we’ve begun to see sector weightings get extremely out of whack once again.
If you would like to see the most up-to-date numbers for S&P 500 sector weightings, simply start a two-week free trial to our Bespoke Premium or Bespoke Institutional service. Click back to this post once you’re signed up to see the numbers.
December 2017 Headlines
S&P 500 Stock Seasonality – 1/8/18
While we don’t ever suggest that investors should base their trading solely on the calendar, there is evidence that the market and many stocks do indeed follow seasonal patterns. This makes our S&P 500 Stock Seasonality report a useful addition to every investor’s toolbox. Using the last ten years worth of price data, our Stock Seasonality report looks at the average returns for the S&P 500, its eleven sectors, and its 500 individual stocks. In the report, we highlight the five stocks in each sector that have historically been the best and worst performers over the next two weeks. For each stock, we also include information such as average returns, the percent of time each stock or sector is positive/outperforms the S&P 500, and its historical performance over the next two weeks for each of the last ten years. The Stock Seasonality report is published on a weekly basis on Mondays, and it is available to all Bespoke Premium and Bespoke Institutional subscribers.
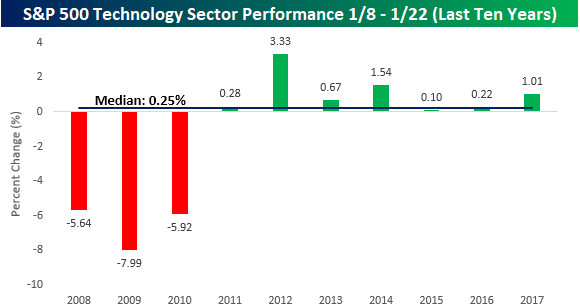
One sector that we wanted to highlight this week is Technology. While the sector’s median return during the upcoming two-week period has been a relatively muted 0.25%, one notable aspect of its performance has been the consistency of gains in recent years. As shown in the chart below, after three years where the sector was down sharply with declines of over 5% in a two-week period (2008, 2009, and 2010), everything has been coming up green for Technology for seven straight years!
For active traders, our Stock Seasonality report is an excellent tool to help keep track of the best and worst times of year for the overall market, sectors, and individual stocks. To see the report, sign up for a monthly Bespoke Premium membership now!
Dumpster Diving
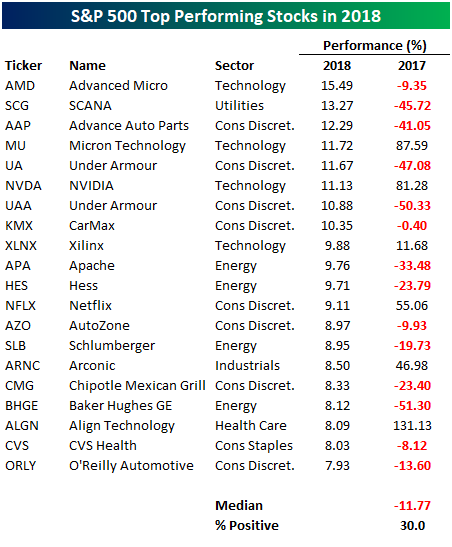
The table below is from last Friday’s Bespoke Report (sign up for a free trial) newsletter that gets emailed to Bespoke clients on a weekly basis. In it, we list the S&P 500’s 20 best-performing stocks to start off the year, and we think it does a good job of summing up investor sentiment in the early days of 2018. Essentially, investors are buying anything that hasn’t already rallied in hopes of catching a move higher. Of the 20 stocks listed, their median return in 2017 was a decline of 11.8% and only six of them were up. Keep in mind that 2017 was a year where the S&P 500 was up close to 20% and three-quarters of the stocks in the index were up on the year.
Bespoke Brunch Reads: 1/7/18
Welcome to Bespoke Brunch Reads — a linkfest of the favorite things we read over the past week. The links are mostly market related, but there are some other interesting subjects covered as well. We hope you enjoy the food for thought as a supplement to the research we provide you during the week.
Asia
HNA Units Missed Payments to More Chinese Banks (Bloomberg)
A Chinese conglomerate that has racked up a record acquisition spree funded by enormous bank borrowing has reportedly missed payments. [Link]
A Browser You’ve Never Heard of Is Dethroning Google in Asia by Newley Purnell (WSJ)
Mobile users in India, Indonesia, and China are flocking to a browser created by a unit of Alibaba, at the expense of Chrome and Safari. [Link; paywall]
Fads
Want a Better Workout? Just Breathe by Tatiana Boncompagni (NYT)
Long considered by elite athletes in certain sports, breathing is getting more attention from the general population as a wellness – if not exactly fitness – strategy. [Link]
Silicon Valley elites are spending $60 for less than 3 gallons of dangerous, unfiltered water — and it’s flying off the shelves by Kate Taylor (Business Insider)
Where to begin? In addition to trespassing in order to gather water from springs, Silicon Valley devotees also risk all manner of diseases for the sake of…well, we’re not exactly sure what the appeal is. [Link]
Crypto
When Will Yale Buy Bitcoin? by Ted Seides (Institutional Investor)
So-called “thought leader” institutional allocators like Yale or CalPERS have not yet taken the plunge on crypto. [Link]
Millennium Fly by Ryan (MarketPOV)
Some background on one of the most ridiculous – and lucrative – trades in Eurodollar pit history, complete with Y2K paranoia and a timely pitch from an analyst. [Link]
Food
Rotisserie Chickens: The ’90s Gift to Supermarkets That Keeps on Giving by Annia Gasparro (WSJ)
An ode to the delicious and fantastically profitable spit-roasted bird that features prominently in grocery stores across the country. [Link; paywall]
Economic Research
A tiger by the tail: estimating the UK mortgage market vulnerabilities from loan-level data by Chiranjit Chakraborty, Mariana Gimpelewicz and Arzu Uluc (BoE Working Papers)
A fascinating new paper that uses novel computer science techniques to create a model of the UK mortgage loan stock which is far more useful for analysis of macroprudential risk than traditional data sets. [Link; 38 page PDF]
Weather
The “Bomb Cyclone” Caused A Spike In Shopping, And The Weather Forecasters Saw It Coming by Leticia Miranda (BuzzFeed)
Some background on the cottage industry of weather prediction for the sake of retail sales forecasting, as well as understanding how weather may impact other consumer behavior. [Link]
Biology
Intentional Fire-Spreading by “Firehawk” Raptors in Northern Australia by Mark Bonta, Robert Gosford, Dick Eussen, Nathan Ferguson, Erana Loveless, and Maxwell Witwer (Journal of Ethnobiology)
If you thought humans were the only species to use fire as a tool, you’d be wrong. This paper documents five species of raptor in Australia which transport fire across distances to scare prey out of hiding. [Link]
Have a great Sunday!