While we don’t ever suggest that investors should base their trading solely on the calendar, there is evidence that the market and many stocks do indeed follow seasonal patterns. This makes our S&P 500 Stock Seasonality report a useful addition to every investor’s toolbox. Using the last ten years worth of price data, our Stock Seasonality report looks at the average returns for the S&P 500, its eleven sectors, and its 500 individual stocks. In the report, we highlight the five stocks in each sector that have historically been the best and worst performers over the next two weeks. For each stock, we also include information such as average returns, the percent of time each stock or sector is positive/outperforms the S&P 500, and its historical performance over the next two weeks for each of the last ten years. The Stock Seasonality report is published on a weekly basis on Mondays, and it is available to all Bespoke Premium and Bespoke Institutional subscribers.
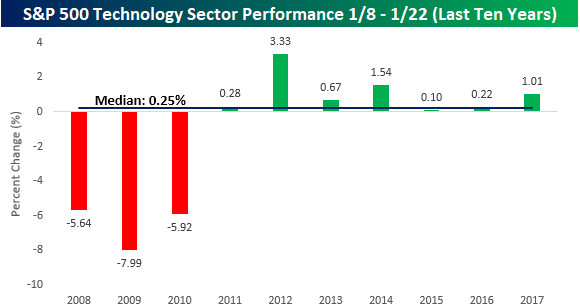
One sector that we wanted to highlight this week is Technology. While the sector’s median return during the upcoming two-week period has been a relatively muted 0.25%, one notable aspect of its performance has been the consistency of gains in recent years. As shown in the chart below, after three years where the sector was down sharply with declines of over 5% in a two-week period (2008, 2009, and 2010), everything has been coming up green for Technology for seven straight years!
For active traders, our Stock Seasonality report is an excellent tool to help keep track of the best and worst times of year for the overall market, sectors, and individual stocks. To see the report, sign up for a monthly Bespoke Premium membership now!
