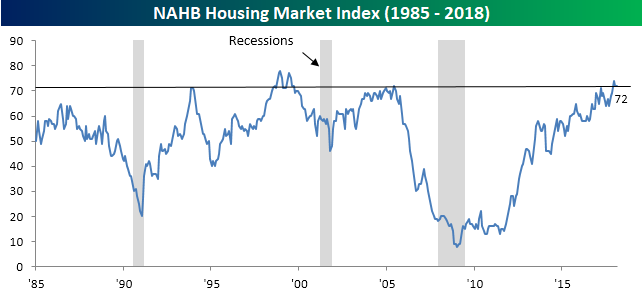
Homebuilder Sentiment Remains Optimistic
Homebuilder sentiment for the month of February came in right in line with expectations today and remains right near its highest levels of the expansion. At a current level of 72, sentiment has only been at more optimistic levels a handful of times. In fact, during the years of the housing bubble in the early 2000s, homebuilder sentiment was never higher.
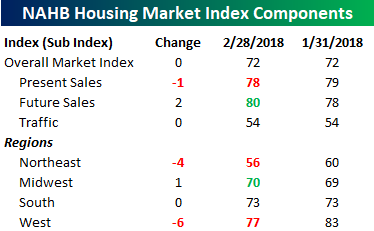
Below we show the breakdown of this month’s report by traffic, sales, and region. As far as traffic and sales is concerned, there wasn’t much in the way of big moves, although Future Sales has only been higher in one other period (the late 1990s). Regionally, sentiment in the Northeast and West saw moderate declines, while the Midwest and South (where property and local taxes are relatively low) was unchanged. This is a trend to watch going forward.
the Bespoke 50 — 2/15/18
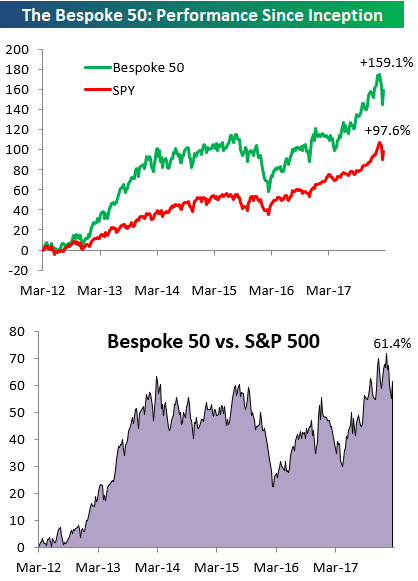
Every Thursday, Bespoke publishes its “Bespoke 50” list of top growth stocks in the Russell 3,000. Our “Bespoke 50” portfolio is made up of the 50 stocks that fit a proprietary growth screen that we created a number of years ago. Since inception in early 2012, the “Bespoke 50” has beaten the S&P 500 by 61.4 percentage points. Through today, the “Bespoke 50” is up 159.1% since inception versus the S&P 500’s gain of 97.6%. Always remember, though, that past performance is no guarantee of future returns.
To view our “Bespoke 50” list of top growth stocks, click the button below and start a trial to either Bespoke Premium or Bespoke Institutional.
Philly Fed Surpasses Expectations
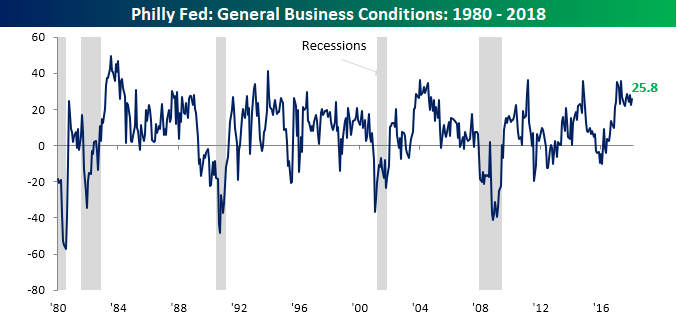
While the Empire Manufacturing report (released earlier) disappointed relative to consensus forecasts, the February Philly Fed report beat expectations, coming in at a level of 25.8 compared to January’s reading of 22.8. At 21 months and counting, the Philly Fed is currently in its longest streak of positive readings since August 2015. More impressively, though, the last 15 months have seen readings in excess of 20. The only other period in the history of the report (since 1980) that saw as many or more monthly readings above 20 was in the 17-month stretch ending in June 1984!
The table below shows the internals of this month’s report, which were mixed. While New Orders surged, Shipments dropped sharply. On the inflation front, Prices Paid saw the third largest increase of any component and is now at its highest levels since 2011 (chart below).
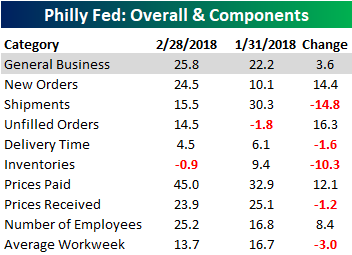

Finally, with respect to prices, one special question asked of respondents in this month’s report had to do with what the expected annual average percent change in prices will be for US consumers over the next ten years. As shown in the graphic below, respondents expect prices to rise by an average of 3% per year for the next ten years, which is up from 2.5% in November. Here again, we have another sign of inflation creeping into the picture.
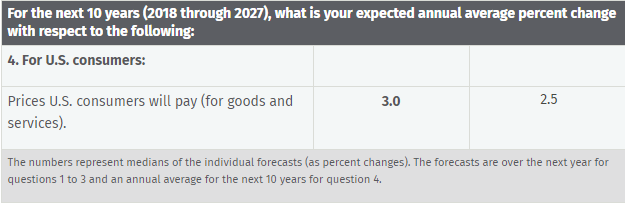
Chart of the Day: Not The Same Old USD
Empire Manufacturing Report Disappoints
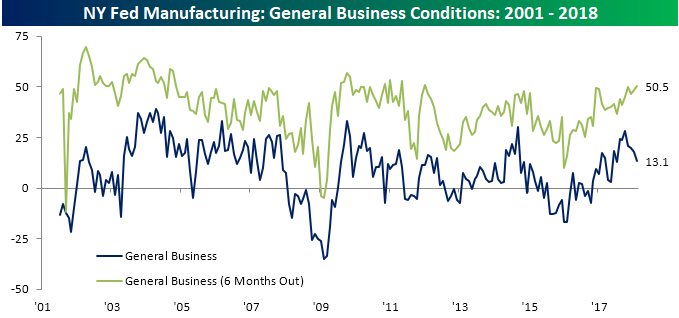
This morning’s report on manufacturing activity in the New York area provides one of the first reads on how business activity is trending for the month of February, and the results were a bit weaker than expected. While economists were expecting the headline General Business Conditions index for the month of February to increase slightly from last month’s reading of 17.7, the actual reading missed to the downside coming in at 13.1. While the current conditions index (dark blue line) declined for the fourth straight month, the index for expected conditions six-months out rose for the fourth time in five months, hitting its highest level since January 2012. Eventually, this divergence has to resolve itself; the only question is in which direction that happens.
The table below breaks down this month’s report by each of its sub-sectors. In terms of current conditions, despite the decline in the headline index, most of the components actually increased this month. Conversely, while the index of General Business conditions for six months out increased, most of the subcomponents declined.

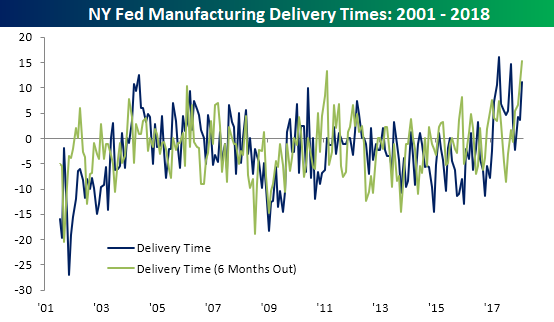
With all the focus on inflation recently, we wanted to highlight a few of the components in this month’s report that could impact prices. The first is Delivery Times. While the current conditions index is well off its recent highs, the index for six months out rose to its highest level in the history of the survey. Extended delivery times can often be a sign of supply problems which can have inflationary implications down the line.
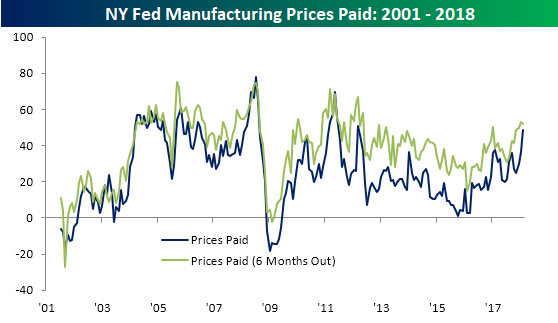
The Prices Paid components of this month’s report also remain elevated with the current conditions index at its highest level since mid-2012.
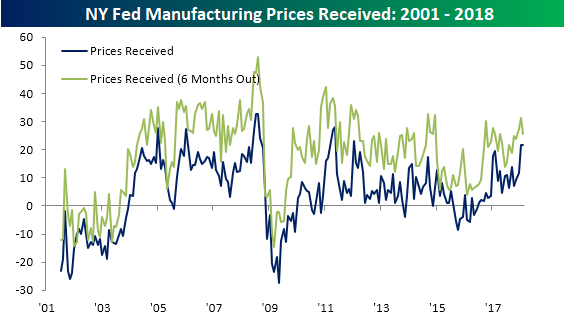
Similarly, Prices Received is also elevated as the current conditions component remains right near its highest level since mid-2012 as well. Based on trends in Prices Received as well as the indicators above, it doesn’t appear as though any upward pressure in prices is going to abate any time soon.
Bulls Back on the Charge
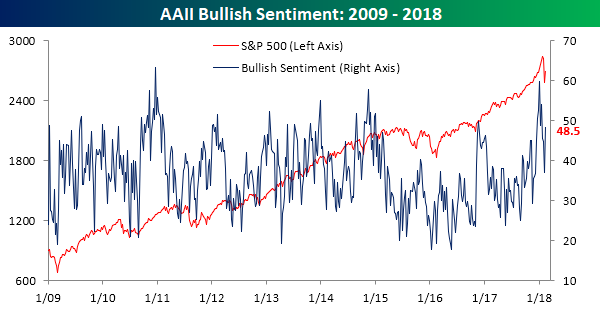
For years we’ve seen a trend where anytime the S&P 500 saw a pullback, any bulls in the weekly AAII sentiment poll would run for the exits and stay there until all signs pointed to an all clear. Earlier this year, we saw bullish sentiment surge to some of the highest levels of the bull market right before the market peaked. Then, when stocks pulled back, so too did bullish sentiment. Heading into this week’s poll results, we expected that bullish sentiment would remain subdued given the volatility in equities. What we saw, though, is that bulls have come charging back! In this week’s survey, bullish sentiment increased from 37.0% up to 48.5% for a gain of 11.5 percentage points. That’s the largest weekly increase since last September. It’s nice to see that investors are finally starting to get comfortable with equities. The time to worry, though, is when that comfort turns into complacency.
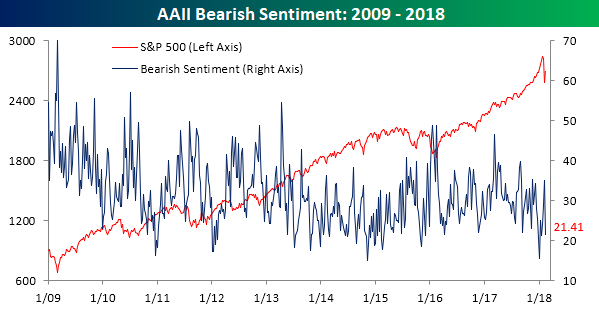
As you might expect given the surge in bullish sentiment, bearish sentiment plunged from 35.0% down to 21.4%. That’s the largest weekly decline in two years!
Jobless Claims Slightly Ahead of Expectations
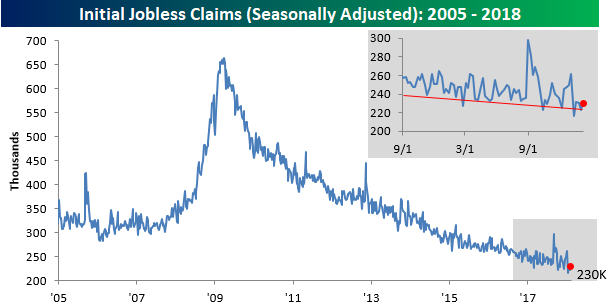
Jobless claims came in slightly ahead of expectations this week, rising from 223K up to 230K (compared to expectations for a rise to 228K). Essentially, the report was inline with expectations, and jobless claims remain extraordinarily low by just about any historical precedent. It has now been 154 straight weeks since claims last printed above 300K. Another seven weeks of sub-300K claims, and the current streak will go down as the longest such streak in the history of the report (dating back to the mid-1960s).
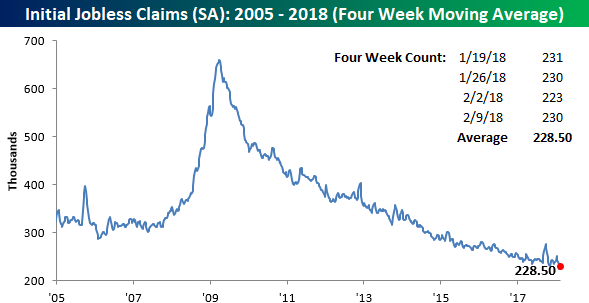
After hitting a multi-decade low last week, the four-week moving average for claims increased by 4K to 228.5K. Prior to last week, that would have been the low for the cycle. Looking ahead to next week, in order to see a move back down to last week’s low, we’ll need to see a weekly print well below 220K.
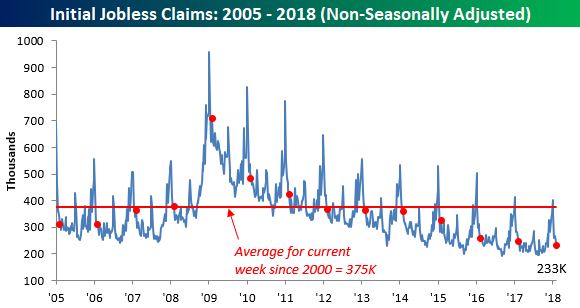
On a non-seasonally adjusted basis, jobless claims continue to impress as well. This week’s print of 233K was more than 140K below the average for the current week of the year dating back to 2000. On top of that, there has never been an NSA reading for the current week of the year that was lower than this week’s print. Never is a long time!
The Closer — Roses Are Red, Violets Are Blue, Inflation Higher & Stocks Too! — 2/14/18
Log-in here if you’re a member with access to the Closer.
Looking for deeper insight on markets? In tonight’s Closer sent to Bespoke Institutional clients, we review stronger-than-forecast CPI and the broad uptick in prices in recent months; we also discuss the likely Fed reaction to that uptick, weekly EIA data on petroleum inventories, and recent energy price action.

See today’s post-market Closer and everything else Bespoke publishes by starting a 14-day free trial to Bespoke Institutional today!
Bespoke’s Earnings Screener — The Best Searchable Earnings Database Online
Bespoke’s interactive Earnings Screener allows users to quickly and easily search for any quarterly earnings report released by any public US company going back to 2001. The specific info for each earnings report includes the date and time of the report, the consensus analyst EPS and revenues estimate, the actual reported EPS and revenues, any guidance that was issued, and the one-day price reaction to the earnings report broken out by opening gap, open to close, and full day’s change.
Along with the ability to search for historical earnings reports by stock ticker, users can also search for earnings reports over any given date range. Searches can be done for companies based on whether they beat or missed earnings or revenue estimates, or whether they raised or lowered guidance. Additionally, you can search for earnings reports based on how much the stock price reacted to the news. This allows users to build unique lists of stocks that have recently reported either exceptionally strong or exceptionally weak earnings results. The capabilities are endless, and most importantly, the search functionality is extremely fast and simple. There’s really nothing like our Earnings Screener in existence, and you can start using it now by starting a two-week free trial to Bespoke Institutional.
Below are a few examples of the type of screens that can be run using our interactive Earnings Screener.
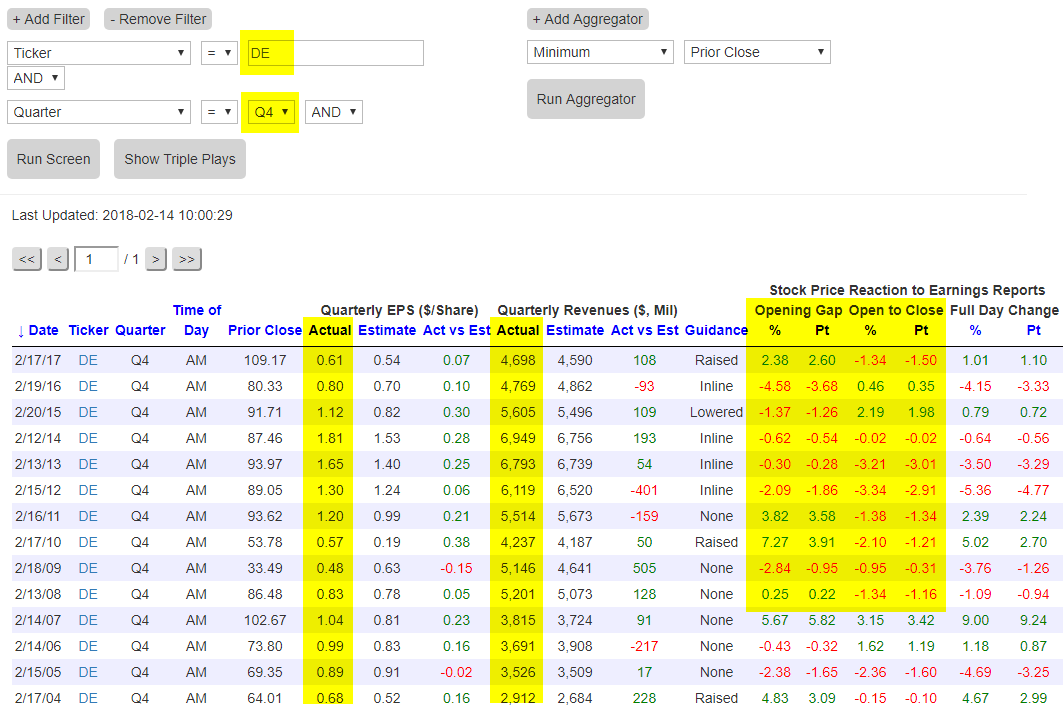
In our first example, we have screened for the historical earnings reports of Deere (DE) — a stock that’s set to report two days from now (2/16). Simply search for “DE” using the “Ticker” option and click “Run Screen.” While the image below only shows earnings reports for DE going back to August 2015, the full database presents the user with all DE earnings reports going back to 2001.
We’ve highlighted a few things concerning Deere’s prior earnings reports. First, it’s noteworthy that the stock has beaten consensus analyst EPS estimates for ten consecutive quarters heading into Friday’s report. This means investors have come to expect an earnings beat from DE at this point, which might result in added weakness for the stock were it to simply meet or miss expectations. We’ve also highlighted that DE has raised forward guidance on four of its last five earnings reports. That’s very impressive, but it also sets the bar high for its upcoming report. Finally, we point out that in reaction to DE’s six most recent earnings reports, the stock has traded higher on the day five times.

In the second example below, we have filtered DE’s historical reports to only show its Q4 earnings releases. With DE set to report its Q4 numbers, this lets users see if this specific quarter has been especially good or bad over the years. You can also easily track year-over-year earnings and revenue numbers using this quarterly filter. In the case of DE, note weakening Q4 revenues over the last few years. Also note that while DE’s stock price has generally been reacting positively to earnings reports over the last year and a half, if you just look at the price reaction to its Q4 report going back to 2008, it has a tendency to either open weak or trade weak from the open to the close.
Let’s stick with DE for one more example of how you can use the Earnings Screener to help with trading decisions. Let’s imagine that DE reports a blowout number on Friday morning and you own the stock. Have you ever wondered whether you should lighten up on a position that’s up big on earnings, or maybe even add to it? The Earnings Screener can help make the call.
If DE reports a Triple Play (beats earnings estimates, beats revenue estimates, raises guidance) and then gaps up at the open of trading on this news, how might shares trade from the open to the close that day? Historical precedent can be your guide. The filter below looks specifically for all instances in which DE has beaten EPS and revenue estimates, raised guidance, and then gaps up on the news. As shown, the Earnings Screener has returned five prior events like this for DE. One came in February 2017, one came in November 2016, one came in February 2010, and two came in 2004. The main takeaway here is shown in the “Open to Close” column that we’ve highlighted. As you can see, on these occasions when DE has gapped up at the open, the stock has traded lower from the open to the close four of five times. Based on DE’s past trading patterns, it may be a smart idea to lighten up at the open of trading if it gaps up big.

In the examples above we’ve used the Earnings Screener to focus specifically on one stock. But users can also use it to track results across the board throughout an earnings season or to find stocks that fit specific earnings result criteria that you set forth.
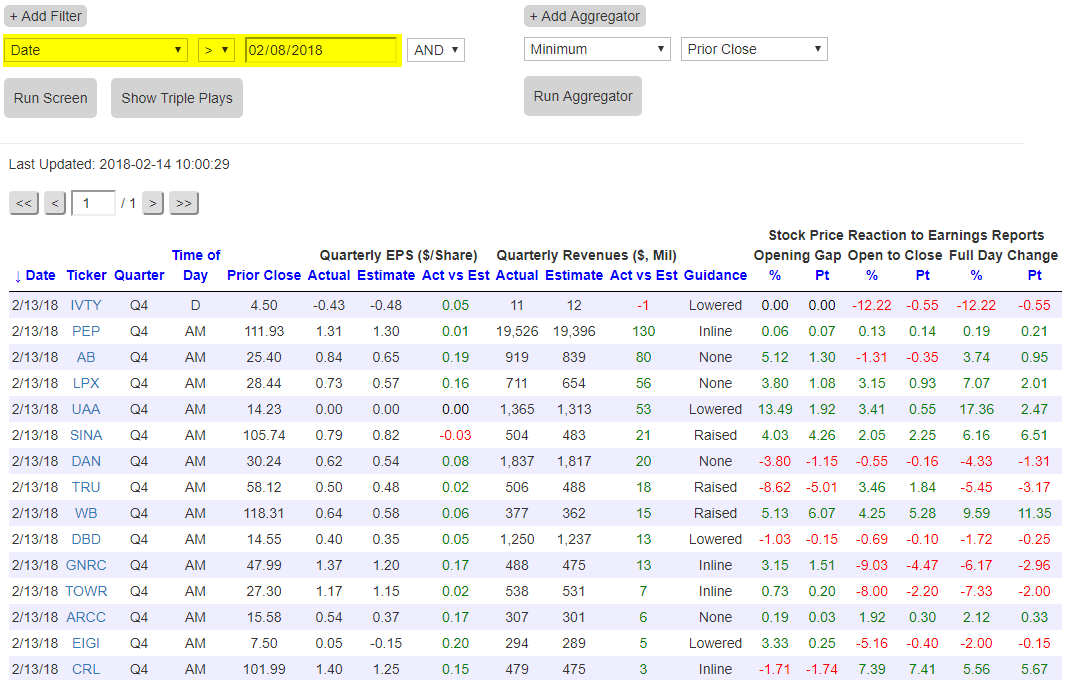
Below, we show you how you can simply pull up all recent earnings reports since a given date. (Remember, with the database you can also pinpoint a specific date range going all the way back to 2001.) Here we’ve asked the database to show us all earnings reports since February 8th, 2018. In the snapshot below, we’ve cut off the data a few rows down, but this screen returned 81 earnings reports in total.
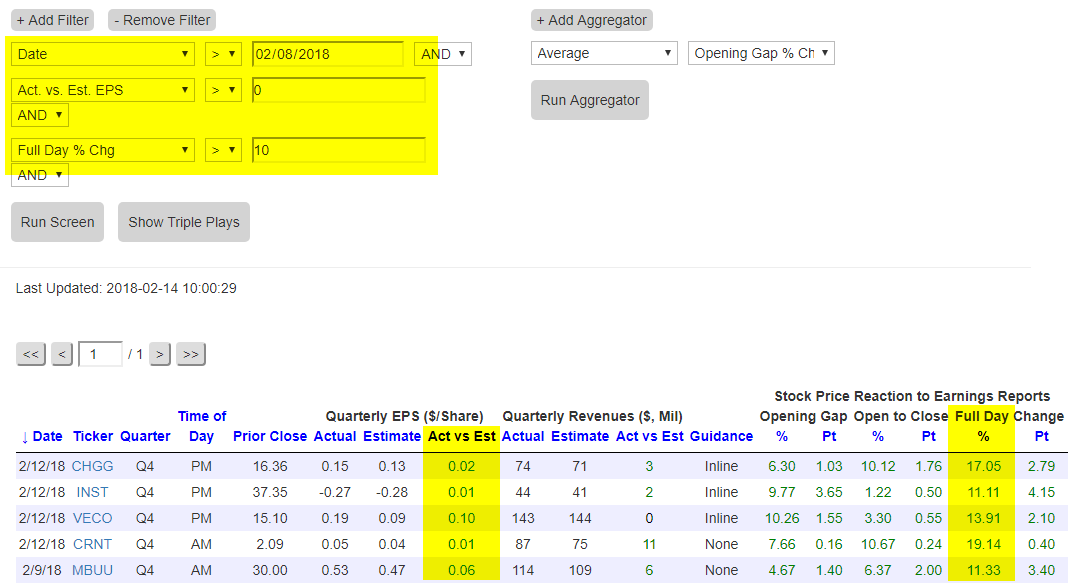
Now let’s say you want to find any stock that has reported since February 8th that beat consensus EPS estimates and also traded up more than 10% in reaction to the news. Using the screening parameters shown below, we’re able to find the five stocks that fit this criteria in an instant. As shown, CHGG, INST, VECO, CRNT, and MBUU all beat EPS and gained more than 10% on the day. Maybe you’d want to run this screen to find stocks with strong earnings and price momentum, or maybe you’d want to use it to find stocks that may have gotten overheated. Whatever it is you’re looking to do, our Earnings Screener can do it!
You can find stocks that may have been unduly hit hard on earnings as well. Below we show all stocks that have reported since 2/8 that beat EPS estimates but traded down more than 5% on the news. Here again, there are five stocks that fit these criteria — IVTY, TRU, GNRC, TOWR, and G.

There are unlimited possibilities with our Earnings Screener that are extremely useful for investors. Whether you’re using the Earnings Screener to defensively monitor stocks that you own ahead of their quarterly earnings reports, or using it to find new long or short opportunities based on earnings strength or weakness, all of the information is available with a few clicks from your mouse.
We highly recommend trying out the Earnings Screener if you have yet to do so. Go ahead and give it a try with a two-week free trial to Bespoke Institutional!
Looking For Action? S&P 1500 Most Volatile Stocks
For traders with a short-term time horizon looking for big moves, we have updated our list of the S&P 1500 stocks trading above $10 that have the largest intraday high-low ranges (based on the average percent spread between the intraday high and low over the last 50 days). The stocks are grouped based on whether they have a rising or falling 50-day moving average (DMA).
While the pickup in volatility from the late January highs has been going on for less than three weeks, we are already starting to see an increase in volatility among the most volatile stocks. Of the 50 names highlighted below, 26 have seen average intraday high low ranges in excess of 5%.
The most volatile stock in the S&P 1500 is Fossil (FOSL) with an average daily range of 7.9%. The stock is up over 75% today alone! While that’s a big move for one day, it doesn’t have nearly as large an impact on the intraday range, because a lot of today’s gain came in the gap which isn’t captured in the intraday high/low spread. In other words, even before today, FOSL was a volatile stock. Besides FOSL, the only other stock in the S&P 1500 that has seen an average daily range of more than 7% is Consol Energy (CEIX).
Other notable names that made the table below include Mattel (MAT), RH, Winnebago (WGO), and Mallinckrodt. The highest priced stock listed is World Acceptance (WRLD). With a share price of $106.99, and an average daily range of 4.8%, the stock typically swings over $5 per day on an intraday basis. Finally, in terms of sector representation, the majority of the stocks listed come from one of three sectors. Technology and Health Care both account for 14 names, while a dozen come from the Consumer Discretionary sector.
