Bespoke Stock Scores — 2/27/18
The Closer — Savings & Investment — 2/26/18
Log-in here if you’re a member with access to the Closer.
Looking for deeper insight on markets? In tonight’s Closer sent to Bespoke Institutional clients, we take a look at savings and investment by sector, and update our tracker for the capex outlook.

See today’s post-market Closer and everything else Bespoke publishes by starting a 14-day free trial to Bespoke Institutional today!
Top Performing Stocks Since February Low
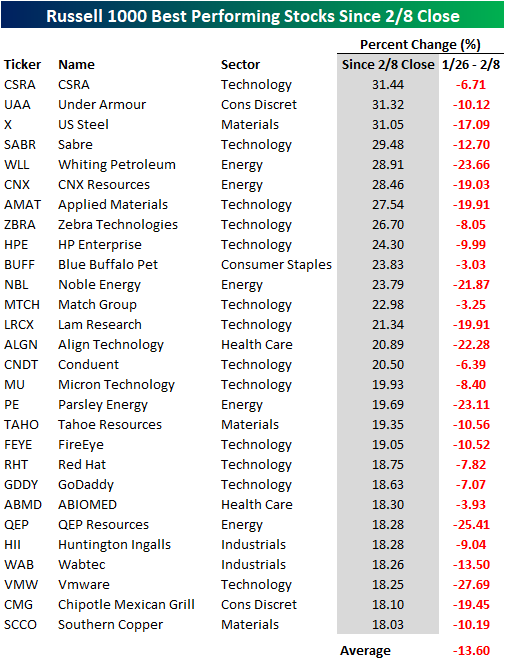
It may be hard to believe, but it has now been a full month since the S&P 500 last closed at a record high. During that span, we have seen one of the quickest 10%+ declines from an all-time high, followed by an impressive rally off the 2/8 lows. During the equity market’s leg down, the average decline of stocks in the Russell 1000 was a drop of 9.7%, and breadth was terrible with 951 of the 975 stocks in the Russell 1000 posting negative returns. The rally on the way up has been a bit weaker in magnitude and breadth, but still strong in its own right. Since the 2/8 closing low, stocks in the Russell 1000 are up an average of 6.0% and all but 98 stocks in the Russell 1000 have seen their share price rise. In the table below, we wanted to highlight both the biggest winners off the lows as well as those stocks that haven’t even been able to rally in a very strong tape.
We’ll start with the winners. Since 2/8, there have been 28 stocks in the Russell 1000 that have rallied more than triple the average 6.0% rally of all stocks. In the table below, we have listed each of those names along with how they performed during the downturn as well. Overall, these stocks saw larger declines than the rest of the market on the way down, but they have more than made up for that weakness on the way up. Fifteen of these stocks have risen more than 20% including US Steel (X), Applied Materials (AMAT), Lam Research (LRCX), and Align Technology (ALGN). In terms of sector representation, investors still can’t get enough of tech stocks as 13 of the 28 names come from that sector. The sector with the next most names is Energy (5). Meanwhile, not a single stock from the Financials, Real Estate, Telecom Services, or Utilities sector made the list.
As mentioned above, just under 100 stocks in the Russell 1000 have declined relative to their 2/8 closing levels, and below we highlight the 23 stocks that have dropped more than 5% during this time. Leading the way lower, Macquarie Infrastructure (MIC) has lost nearly one-third of its value, followed by Brookdale Senior Living (BKD), which has declined 27.4%. Besides these two names, other notable losers include Walmart (WMT) and Biogen (BIIB), which have both dropped nearly 7%. Regarding sector representation, this list is a little more even as no sector represented has more than six names (Consumer Discretionary), while just two stocks from the Technology sector are down more than 5%.
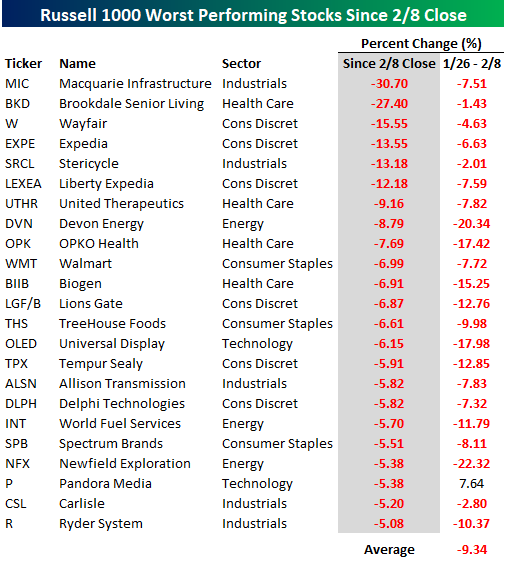
Chart of the Day: Margin Debt Mediocrity
Stock Seasonality: 2/26/18
While we don’t ever suggest that investors should base their trading solely on the calendar, there is evidence that the market and many stocks do indeed follow seasonal patterns. This makes our S&P 500 Stock Seasonality report a useful addition to every investor’s toolbox. Using the last ten years worth of price data, our Stock Seasonality report looks at the average returns for the S&P 500, its eleven sectors, and its 500 individual stocks. In the report, we highlight the five stocks in each sector that have historically been the best and worst performers over the next two weeks. For each stock, we also include information such as average returns, the percent of time each stock or sector is positive/outperforms the S&P 500, and its historical performance over the next two weeks for each of the last ten years. The Stock Seasonality report is published on a weekly basis on Mondays, and it is available to all Bespoke Premium and Bespoke Institutional subscribers.
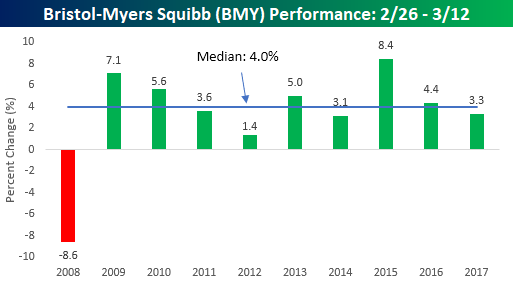
This week’s stock that we have chosen to highlight is Bristol-Myers Squibb (BMY). BMY typically doesn’t trade in as wide a range as other stocks in the market, but in the upcoming two-week period it has been remarkably consistent. BMY hasn’t traded down during the upcoming two-week period since 2008. Overall, the stock’s median gain during this period is a gain of 4.0%.
For active traders, our Stock Seasonality report is an excellent tool to help keep track of the best and worst times of year for the overall market, sectors and individual stocks. To see the report, sign up for a monthly Bespoke Premium membership now!
Bespoke Brunch Reads: 2/25/18
Welcome to Bespoke Brunch Reads — a linkfest of the favorite things we read over the past week. The links are mostly market related, but there are some other interesting subjects covered as well. We hope you enjoy the food for thought as a supplement to the research we provide you during the week.
Financial Musings
Private Equity: Overvalued and Overrated? by Daniel Rasmussen (American Affairs)
A case is to be made that the combination of leverage-driven returns, little impact on operating efficiency, and extremely high fees coupled with illiquidity make private equity a wasted allocation. [Link]
The Pricing of FX Forward Contracts: Micro Evidence from Banks’ Dollar Hedging by Puriya Abbassi and Falk Bräuning (SSRN)
Using transaction-level data on FX forwards from 2014-2016 and balance sheet information, the authors find large differences in banks’ hedging costs. The differences are driven by differences in FX funding gaps, the composition of FX funding, and the cost of capital. All-told the result is a direct path for international transmission of shocks to markets. [Link]
Infamous Investors
Berkshire Hathaway Inc. Annual Letter by Warren Buffett (Berkshire Hathaway)
The annual report on how things were for the large conglomerate over the past 12 months. [Link; 16 page PDF]
Risky Crypto Bet Dents Dennis Gartman’s Retirement Account by Lily Katz (Bloomberg)
Widely-followed newsletter author and speculator Dennis Gartman had some pretty terrible trades related to the blockchain play RIOT over the past week. [Link; auto-playing video]
Economics
Why has the US fallen behind the UK in labor force participation? by Ernie Tedeschi (Medium)
An excellent data-driven analysis of changes in the generally similar labor force dynamics in the US and the UK. When adjusting for demographics, health and disability, labor force discouragement, and family care for women are the biggest drivers of recent shifts. [Link]
The distribution of wages and wage inequality by Pedro Portugal, Pedro S. Raposo, and Hugo Reis (Banco de Portugal)
An investigation of why Portugal has seen large structural shifts in its labor market but relatively little change in income inequality over the past quarter century. [Link; 13 page PDF]
The Economy Is Getting Hotter. Is a Productivity Boom Next? by Neil Irwin (NYT)
A long rambling look at the relationship between tight labor markets and productivity, which may be a response to demand just as much as supply. [Link; soft paywall]
Chattanooga
US economy: The growth puzzle by Sam Fleming (FT)
A case-study in what may drive the next leg of productivity growth, through the lens of the East Tennessee industrial hub that’s been a huge success story. [Link; paywall]
The City That Was Saved by the Internet by Jason Koebler (Vice)
One of the reasons Chattanooga has been so successful is the bold steps the city took early on to make sure that businesses had adequate connectivity. [Link]
Olympics
In PyeongChang, maintaining Olympic venues relies on a poor and aging workforce by Chico Harlan and Yoonjung Seo (WaPo)
An army of senior citizens is keeping PyeongChang clean and comfortable during the games, a sign of the broken safety net and impoverished status of the country’s elders. [Link; soft paywall]
German Olympians Drink a Lot of (Nonalcoholic) Beer, and Win a Lot of Gold Medals by Ben Crair and Andrew Keh (NYT)
Gatorade’s got nothing on fizzy hops, which is the recovery drink of course in Germany…sans alcohol, for those at the highest level of competition. [Link; soft paywall]
Surveying Society
He Predicted The 2016 Fake News Crisis. Now He’s Worried About An Information Apocalypse. by Charlie Warzel (BuzzFeed)
A survey of the media landscape with deteriorating trust, fracturing viewership, and vulnerable interpretation that has caused so much trouble over the last few years. [Link]
The Poison We Pick by Andrew Sullivan (NYMag)
One explanation for the surging use of opioids – especially in relatively vulnerable or economically depressed areas – is the simple truth that our society is a miserable place to live for many people. [Link]
It’s Time to End ‘Trending’ by Brian Feldman (NYMag)
The concept of “trending” is one that propagates mistruths, creates online mobs, and aids in the spread of disinformation, with no clear upsides. [Link]
Silicon Valley parents are raising their kids tech-free — and it should be a red flag by Chris Weller (Business Insider)
Many of the people who fuel the tech world’s increasing dissemination of screens into our lives are cautious about allowing their own children access to the same technology. [Link]
Celebrity
What Ever Happened To Brendan Fraser? by Zach Baron (GQ)
An emotional read on what drove one of Hollywood’s leading men out of the limelight, despite box office appeal, marketability, and acting chops. [Link]
In One Tweet, Kylie Jenner Wiped Out $1.3 Billion of Snap’s Market Value by Justina Vasquez (Bloomberg)
A tweet by famed Kardashian family member Kylie Jenner resulted in tumbling shares of Snap, which has been struggling since a redesign and is having a hard time competing with Facebook’s Instagram. [Link]
Consequences
In Vaccines we Trust? The Effects of Anti-vaccine Propaganda on Immunization: Evidence from Pakistan by Monica Martinez-Bravo and Andreas Stegmann (CEMFI)
After the Pakistani public learned a fake vaccination campaign had been used to identify Osama bin Laden’s hideout (ultimately leading to his killing by the US military), vaccination rates plunged in areas that had higher levels of support for Islamist groups. [Link; 44 page PDF]
Read Bespoke’s most actionable market research by starting a two-week free trial today! Get started here.
Have a great Sunday!
The Bespoke Report — 2/23/18
The Closer: End of Week Charts — 2/23/18
Looking for deeper insight on global markets and economics? In tonight’s Closer sent to Bespoke clients, we recap weekly price action in major asset classes, update economic surprise index data for major economies, chart the weekly Commitment of Traders report from the CFTC, and provide our normal nightly update on ETF performance, volume and price movers, and the Bespoke Market Timing Model. This week, we’ve added a section that helps break down momentum in developed market foreign exchange crosses.

The Closer is one of our most popular reports, and you can sign up for a free trial below to see it!
See tonight’s Closer by starting a two-week free trial to Bespoke Institutional now!
B.I.G. Tips – Death by Amazon – 2/23/18
S&P 500 Quick-View Chart Book: 2/23/18
Each weekend as part of our Bespoke Premium and Institutional research service, clients receive our S&P 500 Quick-View Chart Book, which includes one-year price charts of every stock in the S&P 500. You can literally scan through this report in a matter of minutes or hours, but either way, you will come out ahead knowing which stocks, or groups of stocks, are leading and lagging the market. The report is a great resource for both traders and investors alike. Below we show the front page of this week’s report which contains price charts of the major averages and ten major sectors.
For each of the major averages, it’s been a week of consolidation as in most cases, the big rebound off the early February lows has stalled out right around the 50-day moving averages. With the major averages stuck in the middle of a no-man’s land, the number of 52-week highs and lows has declined. As shown below, not a single major index or sector hit a high or a low this week, and in terms of individual stocks, there were just 39 new highs and 13 new lows.
To view our entire S&P 500 Chart Book, sign up for a 14-day free trial to our Bespoke Premium research service.
