Bespoke’s Global Macro Dashboard — 1/24/18
Bespoke’s Global Macro Dashboard is a high-level summary of 22 major economies from around the world. For each country, we provide charts of local equity market prices, relative performance versus global equities, price to earnings ratios, dividend yields, economic growth, unemployment, retail sales and industrial production growth, inflation, money supply, spot FX performance versus the dollar, policy rate, and ten year local government bond yield interest rates. The report is intended as a tool for both reference and idea generation. It’s clients’ first stop for basic background info on how a given economy is performing, and what issues are driving the narrative for that economy. The dashboard helps you get up to speed on and keep track of the basics for the most important economies around the world, informing starting points for further research and risk management. It’s published weekly every Wednesday at the Bespoke Institutional membership level.
You can access our Global Macro Dashboard by starting a 14-day free trial to Bespoke Institutional now!

12 Record Closing Highs and Counting
So far in 2018, every trading day where the S&P 500 has finished the day higher has been a record all-time closing high. Just to show how little downside pressure there has been, in the three days where the S&P 500 did trade lower this year, the cumulative decline was just 17 points! That’s five fewer points than this past Monday’s 22-point gain alone. In total, there have now been twelve record closing highs in 2018, which is already tied for the fourth most in a single month in the index’s history. The record for a single month is 16 back in June 1955, and with just six trading days left this month, the odds are slim that we tie, let alone beat the record.
In the lower chart, we have shown the S&P 500’s performance in the three months that followed each of the prior months where the S&P 500 saw 12 or more record highs in a single month. Of the six prior months shown, the market went on to post further gains five times. The only down period was a 1.9% decline in November 1961, while the five periods where the S&P 500 was positive, the index put up gains ranging from 1.8% to 6.4%.
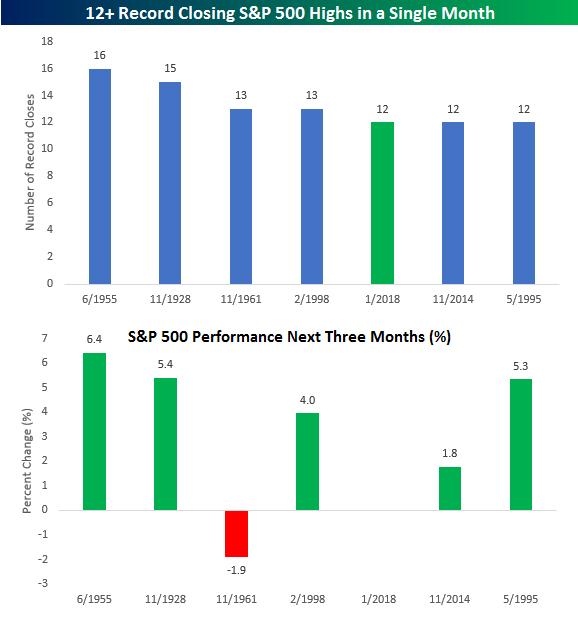
Chart of the Day – Best Start for S&P 500 Since 1987
The Closer — State Unemployment Improvement — 1/23/18
Log-in here if you’re a member with access to the Closer.
Looking for deeper insight on markets? In tonight’s Closer sent to Bespoke Institutional clients, we break down monthly state-level employment and unemployment data from the BLS.

See today’s post-market Closer and everything else Bespoke publishes by starting a 14-day free trial to Bespoke Institutional today!
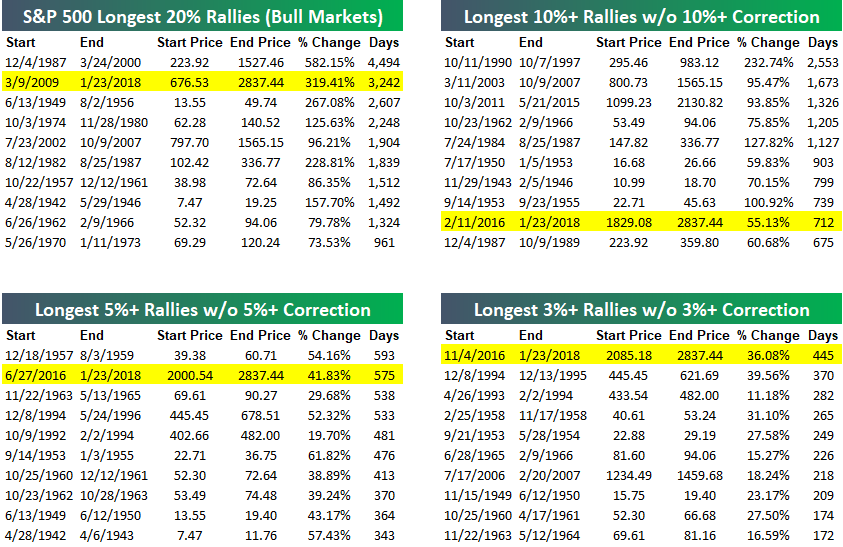
The Energizer Market
The S&P 500 notched yet another new all-time high today. Below is an updated look at our tables highlighting the length of days it has been since the last meaningful pullback.
As shown, we’re now at 445 days since the last 3%+ pullback (a record), 575 days since the last 5%+ pullback (18 days from a record), 712 days since the last 10%+ pullback (not close to a record), and 3,242 days since the last 20%+ pullback (2nd longest).
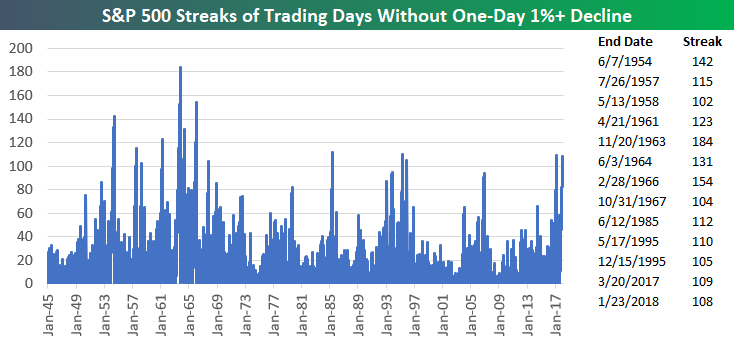
Another 100+ Trading Day Streak Without a 1%+ Decline
We’ve been saying this for a while now, but the next time the S&P 500 experiences a drop of more than 1%, it’s going to feel like a crash to many investors. That’s because 1%+ down days have become so foreign lately. As investors get used to only very small declines on very rare occasions, drops of 1%-2% — which were much more frequent up until the end of 2016 — feel MUCH more painful when they finally do occur.
Below is a chart showing historical streaks of trading days without a 1%+ down day going back to 1945. While the current streak of 108 trading days isn’t that close to the record streak of 184 trading days seen back in 1963, it’s notable that we just had a 109-trading day streak end last March as well.
Prior to the two recent 100+ trading day streaks without a 1%+ down day, the last two came back in 1995. 1995 was a year that saw very similar action to what we’ve seen over the last 12 months.
If we tighten up the margin of the decline even more, the S&P 500 has not had a decline of 0.60% in 96 trading days. As shown below, that’s easily a record going back to 1945!
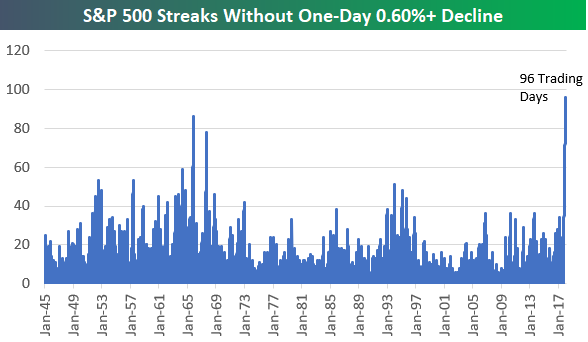
Chart of the Day: Model Portfolio Charts
Netflix (NFLX) Joins the $100 Billion Club
Netflix (NFLX) is up big yet again following its Q4 2017 earnings release last night after the close. Prior to its earnings report yesterday, we sent the table below to Bespoke Institutional subscribers who have access to our indispensable Earnings Screener tool. As shown in the table, Netflix (NFLX) had gapped up following 14 of its 15 January earnings reports since it IPOd! That’s an incredible trend, and it held yet again this time around. Following today’s gap up of over 10% for NFLX, it has now gapped up following 15 of its last 16 January earnings reports. If you have not yet tried out our Earnings Screener, you should really do so now! The Screener allows you to easily filter through more than 150,000 quarterly earnings reports for more than 5,000 stocks going back 15 years. Sign up for a 14-day free trial to Bespoke Institutional to gain access.

With Netflix’s (NFLX) move higher today, its market cap has pushed above the $100 billion mark. That’s a big deal because it joins an exclusive club of 60 other companies that have a market cap of more than $100 billion. Below is a look at these $100 billion companies sorted from largest to smallest. Today alone, Netflix’s market cap surpassed companies like United Tech (UTX), Broadcom (AVGO), Morgan Stanley (MS), Goldman Sachs (GS), and Caterpillar (CAT).

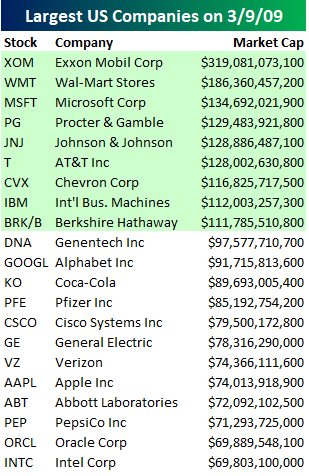
While the $100 Billion Club is an exclusive list of just 61 companies, we wondered how big the list was back in early 2009 at the lows of the Financial Crisis. The answer? Back then, just nine companies were part of the $100 Billion Club at the Financial Crisis lows, and Exxon Mobil (XOM) was the largest at just $319 billion! It’s truly astounding how far we’ve come since those dark days nine years ago.
Apple (AAPL) — now the largest company in the world — is nearly 3x as large as XOM was back then. In fact, the combined market caps of Apple and Alphabet now (roughly $1.7 trillion) is larger than the combined markets caps of the 13 largest companies at the lows in 2009. There are now 27 companies that are larger than the 2nd largest company (WMT) was in 2009. We could go on and on with similar stats, but you get the point!
B.I.G. Tips – Everything’s Overbought…Except For Utilities and Real Estate
The chart below comes from the second page of our Morning Lineup report, and it shows the percentage of S&P 500 stocks that are trading at overbought (red line) and oversold (green line) levels. For the purposes of this chart, overbought (oversold) is defined as a stock trading more than one standard deviation above (below) its 50-day moving average (DMA). Since the start of the year, the number of overbought stocks has surged from a reading below 50% at the end of 2017 to above 70% yesterday (the highest percentage since March 2016).

What’s really interesting about the current set-up is that even though more than 70% of stocks in the S&P 500 are overbought, 11% are trading at oversold levels. Going back to 1990, there has never been a time where the percentage of overbought stocks exceeded 70% and the percentage of oversold stocks was above 10% simultaneously! The major culprits behind the high percentage of oversold stocks have been the Real Estate and Utilities sectors. As shown in the screenshots below from our Trend Analyzer tool, these two sectors account for 46 of the 56 stocks in the S&P 500 that are oversold. The disparity between these two sectors and everything else is extreme, to say the least.
So what can we expect from the market following extreme readings in the percentage of stocks that are overbought? Our just published B.I.G. Tips report looks at prior periods where this reading reached extreme levels and shows how equities performed going forward. Get your hands on it now with a two-week free trial to Bespoke Premium!


For anyone interested in this report, check it out by signing up for a Bespoke Premium membership now!