Global Bloodbath
The S&P 500 fell 4.1% today for its first 4%+ drop since August 18th, 2011. There have been 144 prior one-day drops of 4%+ for the S&P, and on average the index has gained 0.32% on the next trading day. We’ll see how that stat holds up tomorrow!
Below is a look at the performance of various asset classes using key ETFs tracked in our Trend Analyzer tool. For each ETF, we highlight its total return today, its total return since the 1/26 peak for the S&P 500, and its total return year-to-date so far in 2018.
Things were looking pretty good for global stock markets up until about a week ago, but as you can see, most areas of the equity asset class are now down on the year. That’s an amazing turnaround in a very short period of time. In fact, since 1/26, the only ETF in our Matrix that has seen a positive return is short-term Treasuries (SHY).
To read our in-depth commentary and analysis of the recent sell-off, start a 14-day free trial to one of our membership options now!

B.I.G. Tips – Where Things Stand
B.I.G. Tips – Another Streak Broken
Chart of the Day: 50-Day Moving Average Streak in Jeopardy
S&P 500 Stock Seasonality – 2/5/18
While we don’t ever suggest that investors should base their trading solely on the calendar, there is evidence that the market and many stocks do indeed follow seasonal patterns. This makes our S&P 500 Stock Seasonality report a useful addition to every investor’s toolbox. Using the last ten years worth of price data, our Stock Seasonality report looks at the average returns for the S&P 500, its eleven sectors, and its 500 individual stocks. In the report, we highlight the five stocks in each sector that have historically been the best and worst performers over the next two weeks. For each stock, we also include information such as average returns, the percent of time each stock or sector is positive/outperforms the S&P 500, and its historical performance over the next two weeks for each of the last ten years. The Stock Seasonality report is published on a weekly basis on Mondays, and it is available to all Bespoke Premium and Bespoke Institutional subscribers.
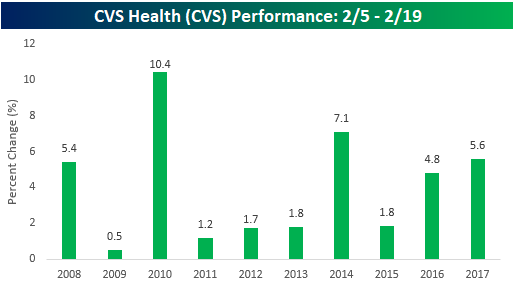
One stock that we wanted to highlight this week is CVS Health (CVS). CVS hasn’t been the top performing stock in the S&P 500 during the upcoming two-week period from 2/5 through 2/19, but it has been remarkably consistent. As shown in the chart below, the stock has been up during this two-week period for ten straight years for a median gain of 3.3%. Must be a boost from all the flu patients rushing for supplies to help ease the pain! Along with CVS, there are another six S&P 500 stocks that have been positive during the upcoming two-week period for ten straight years, including two that have seen median gains in excess of 7%.
For active traders, our Stock Seasonality report is an excellent tool to help keep track of the best and worst times of year for the overall market, sectors, and individual stocks. To see the report and which two stocks have performed even better than EA in the upcoming two-week period, sign up for a monthly Bespoke Premium membership now!
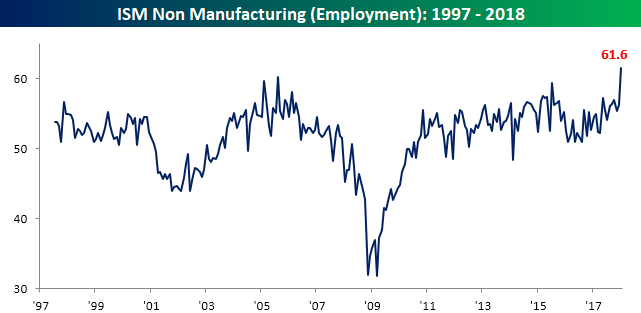
ISM Services Back at Cycle Highs
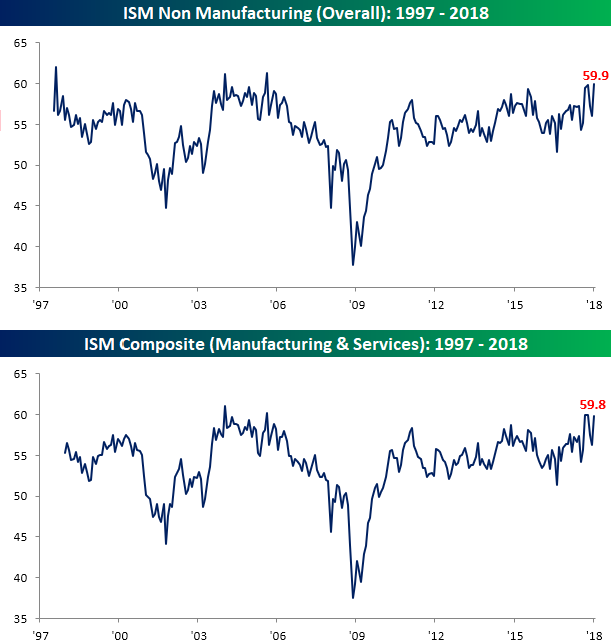
While activity in the Manufacturing sector slowed down modestly during the month of January, things really picked up steam in the Services sector, and by even more than economists were expecting. As shown in the top chart below, the ISM Services report for January surged to 59.9 from last month’s reading of 56.0. Not only was January’s 3.9 m/m increase the sixth largest since 1997 and the third largest of the current economic expansion, but at 59.9, the headline index has only been higher in three other months. On a combined basis and accounting for each sector’s share of the total economy, our January combined ISM came in at 59.8, which is also right near the highest levels of the current economic cycle.
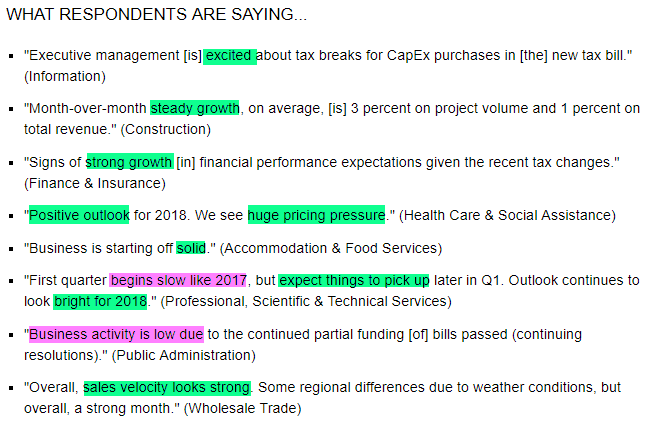
Commentary from respondents was also positive this month. Outside of the Public Administration sector, respondents are extremely positive on the state of their businesses.
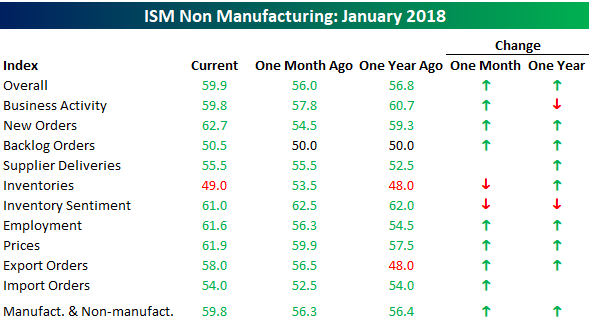
The table below summarizes each of the sub-indices of the ISM Non-Manufacturing report on both a m/m and y/y basis. Outside of Inventories, which is just barely below 50, every other sub-index is showing growth and in most cases very strong and accelerating growth. New Orders saw the largest m/m increase and is now at its highest level since early 2011. Two sub-indices we wanted to highlight specifically, though, are Employment and Prices Paid. As shown in the top chart below, the Employment component of this month’s report broke out to a record high reinforcing the theme of a strong labor market. Obviously, one worry here is that strong employment will lead to upward wage pressure ad higher prices, but while the Prices Paid component of this month’s report did rise, the magnitude of the increase was modest.

Bespoke Brunch Reads — Super Bowl Sunday Edition — 2/4/18
Welcome to Bespoke Brunch Reads — a linkfest of the favorite things we read over the past week. The links are mostly market related, but there are some other interesting subjects covered as well. We hope you enjoy the food for thought as a supplement to the research we provide you during the week.
Mind the Gap
Two interesting write-ups on an amazing stat we uncovered in a Chart of the Day a few weeks ago.
The Stock Market Works By Day, But It Loves the Night by Jeff Sommer (NYT) [Link; soft paywall]
The Investors’ After Party by Vito Racanelli (Barron’s) [Link]
Tax Reform Tales
B.R.E.A.M. (Bonds Rule Everything Around Me) by Alexandra Scaggs (FTAV)
While offshore profits are overwhelmingly held in dollar-denominated assets and therefore won’t be of much foreign exchange impact, they will create radical shifts in the funding of offshore USD markets and the US bond markets’ structure. [Link; registration required]
Tucked Into the Tax Bill, a Plan to Help Distressed America by Jim Tankersley (NYT)
A billion and a half dollars doesn’t sound like much but if properly executed, a small provision of the recent tax reform package could kick-start more investment and activity in rural and low income areas that have been largely left behind during the current recovery. [Link; soft paywall]
Where We Live
A Gentrification Story With A Happy Ending by Jon Michaud (NYer)
The story of a diverse Harlem community staving off the closure of a legendary watering hole, saving what is not only a thriving business but also a community institution. [Link]
U.S. soldiers are revealing sensitive and dangerous information by jogging by Liz Sly (WaPo)
Thanks to the release of billions of GPS data points logged by its users, workout app Strava has unwittingly revealed the locations and layouts of US armed forces locations around the world. [Link; soft paywall]
Labor
Companies Will Learn to Love Unions by Conor Sen (Bloomberg View)
Historically unions have been viewed as factor increasing cost of labor, but they also serve to secure supply for businesses. [Link]
Media
Podcast Listeners Really Are The Holy Grail Advertisers Hoped They’d Be by Miranda Katz (Wired)
On average podcast listeners make it through 90% of the length of the programs they listen to, a fantastically enthusiastic engagement rate. [Link]
Concerning Lending
How the Finance Industry Is Trying to Cash In on #MeToo by Matthew Goldstein and Jessica Silver-Greenberg (NYT)
With rising numbers of lawsuits and settlement payments to victims of sexual harassment, specialized lenders are looking to cash in by financing the payouts. [Link; soft paywall]
Cash-Strapped Chinese Giant Taps a New Money Source: Its Workers by Alexandra Stevenson and Cao Li (NYT)
Faced with profitability pressures and a mountain of debt after a truly absurd acquisition binge, Chinese conglomerate HNA is asking employees to pony up and make loans to the company. [Link; soft paywall]
Crypto
Massive Cryptocurrency Heist Spurs Call for More Regulation by Yuji Nakamura and Andrea Tan (Bloomberg)
A Japanese cryptocurrency exchange will go down as one of the largest heist victims in history after thieves were able to hack almost half a billion dollars worth of tokens. [Link; auto-playing video]
U.S. Regulators Subpoena Crypto Exchange Bitfinex, Tether by Matthew Leising (Bloomberg)
A Japanese cryptocurrency exchange will go down as one of the largest heist victims in history after thieves were able to hack almost half a billion dollars worth of tokens. [Link; auto-playing video]
Economic Research
Speed under sail during the early Industrial Revolution by Morgan Kelly and Cormac Ó Gráda (Voxeu)
Using detailed records of positions and weather conditions from ships logs, the authors demonstrate notable improvement in shipping speeds during the 18th century that economists had previously dismissed. [Link]
Chips
How Apple Built a Chip Powerhouse to Threaten Qualcomm and Intel by Mark Gurman (Bloomberg)
Vertical integration is back! Faced with sub-optimal results from suppliers’ chipsets (which more recently have been beset by security concerns), Apple’s bet on internally developed chips looks increasingly prescient. [Link]
Social Media
The Follower Factory by Nicholas Confessore, Gabriel J.X. Dance, Richard Harris, and Mark Hansen (NYT)
Inside the world of fake followers and purchased influence, which runs rampant in a world where social media credibility has become increasingly important. [Link]
Investors
David Einhorn’s Greenlight Capital Lost 6% in January by Juliet Chung (WSJ)
Hedge fund performance in general has lagged in a period of low volatility and sky-high performance for the highest-market cap stocks, but Greenlight’s shorts in particular look painful. [Link; paywall]
Law & Order
Has the Supreme Court Legalized Public Corruption? by Matt Ford (The Atlantic)
While Ford’s analysis isn’t new, his observations about the implications of a 2017 Supreme Court decision which vacated a corruption conviction against former Virginia Governor McDonnell (a Republican) look especially prescient given prosecutors’ failed prosecution of NJ Senator Menendez (a Democrat). [Link]
Health Care
Drug firms shipped 20.8M pain pills to WV town with 2,900 people by Eric Eyre (Charleston Gazette-Mail)
A staggering anecdote that gives some insight into the supply-side of the opioid crisis. [Link; auto-playing video]
Amazon, Berkshire, JPMorgan Link Up to Form New Health-Care Company by Zachary Tracer and Hugh Son (Bloomberg)
While it’s not clear what exactly will come of the new initiative, there was lots of attention this week as three scions of modern capitalism announced a new effort to attack costs. [Link; auto playing video]
Read Bespoke’s most actionable market research by starting a two-week free trial today! Get started here.
Have a great Super Bowl Sunday!
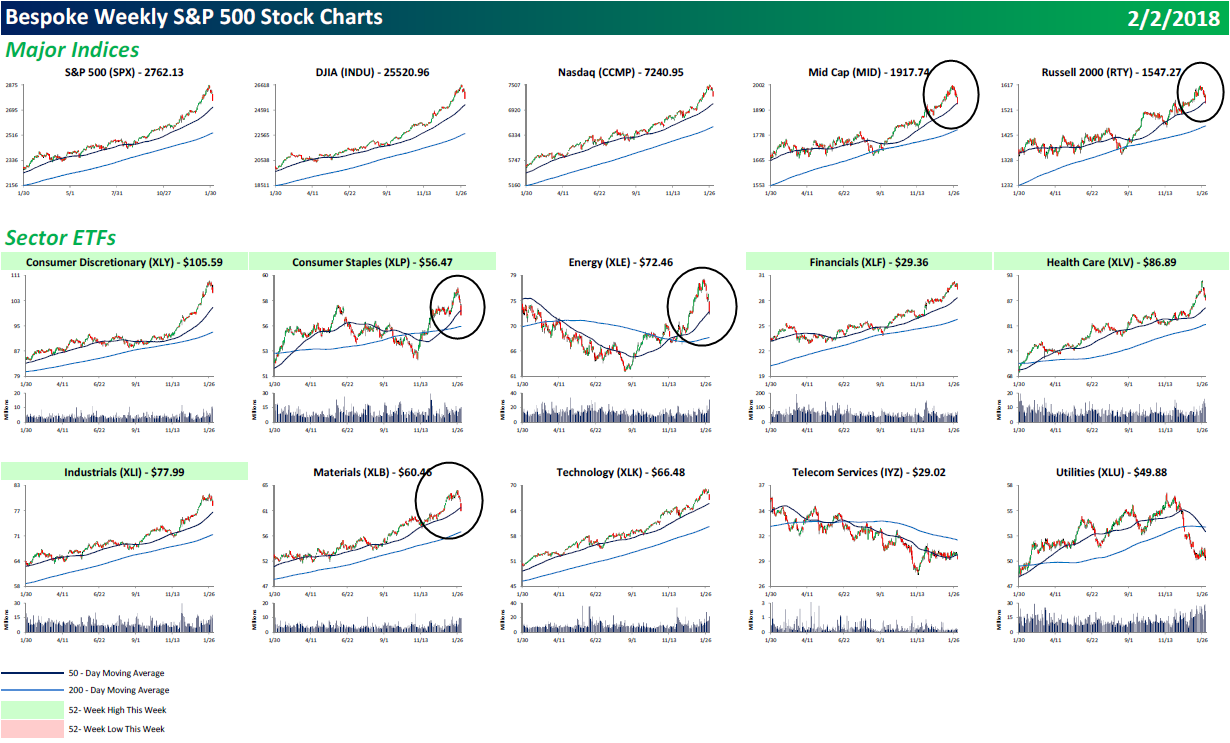
Bespoke’s S&P 500 Quick-View Chart Book — 2/2/18
Each weekend as part of our Bespoke Premium and Institutional research service, clients receive our S&P 500 Quick-View Chart Book, which includes one-year price charts of every stock in the S&P 500. You can literally scan through this report in a matter of minutes or hours, but either way, you will come out ahead knowing which stocks, or groups of stocks, are leading and lagging the market. The report is a great resource for both traders and investors alike. Below we show the front page of this week’s report which contains price charts of the major averages and ten major sectors.
Given the steep decline we saw in US equity markets this week, our Chart Book is really helpful in identifying areas of the market that are starting to break down. As you can see below, of the major indices, both mid-caps and small-caps broke below their 50-day moving averages today. That’s not a good sign for large caps. Additionally, of the major sectors, Consumer Staples, Energy, and Materials broke below their 50-days.
To view our entire S&P 500 Chart Book, sign up for a 14-day free trial to our Bespoke Premium research service.
The Bespoke Report – 2/2/18 – They’re Selling Everything
The Closer: End of Week Charts — 2/2/18
Looking for deeper insight on global markets and economics? In tonight’s Closer sent to Bespoke clients, we recap weekly price action in major asset classes, update economic surprise index data for major economies, chart the weekly Commitment of Traders report from the CFTC, and provide our normal nightly update on ETF performance, volume and price movers, and the Bespoke Market Timing Model. This week, we’ve added a section that helps break down momentum in developed market foreign exchange crosses.

The Closer is one of our most popular reports, and you can sign up for a free trial below to see it!
See tonight’s Closer by starting a two-week free trial to Bespoke Institutional now!