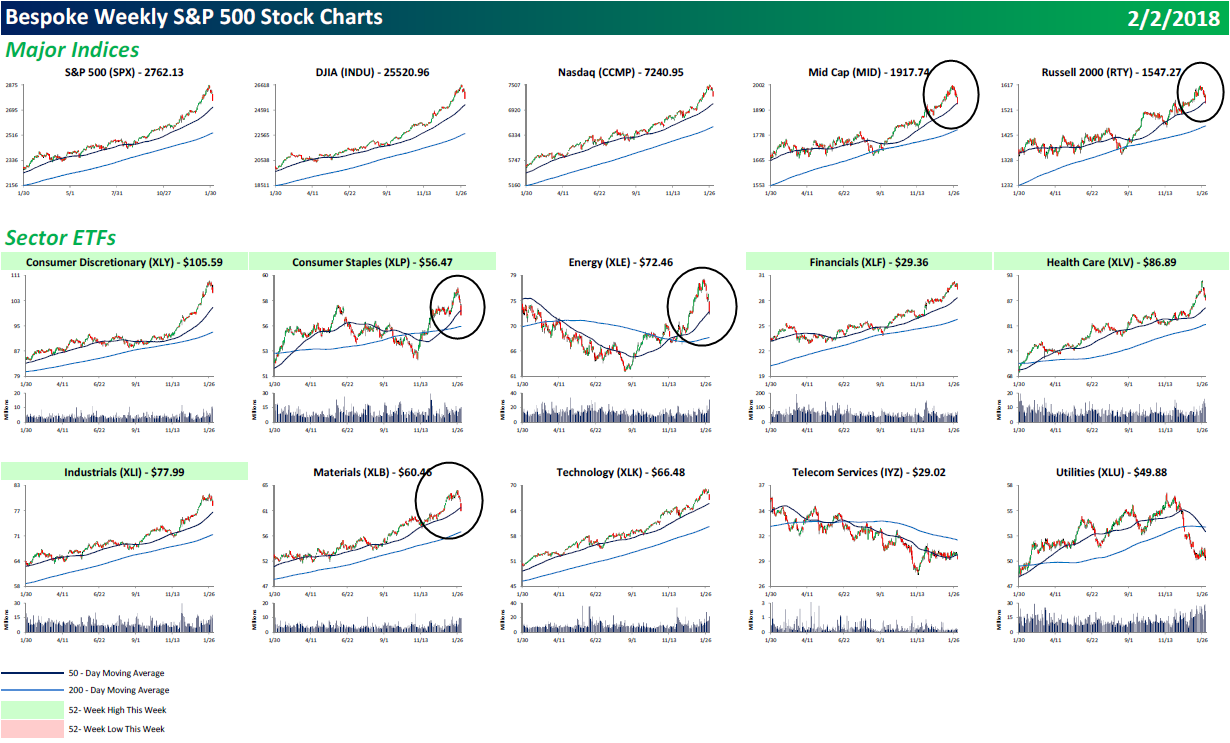
Each weekend as part of our Bespoke Premium and Institutional research service, clients receive our S&P 500 Quick-View Chart Book, which includes one-year price charts of every stock in the S&P 500. You can literally scan through this report in a matter of minutes or hours, but either way, you will come out ahead knowing which stocks, or groups of stocks, are leading and lagging the market. The report is a great resource for both traders and investors alike. Below we show the front page of this week’s report which contains price charts of the major averages and ten major sectors.
Given the steep decline we saw in US equity markets this week, our Chart Book is really helpful in identifying areas of the market that are starting to break down. As you can see below, of the major indices, both mid-caps and small-caps broke below their 50-day moving averages today. That’s not a good sign for large caps. Additionally, of the major sectors, Consumer Staples, Energy, and Materials broke below their 50-days.
To view our entire S&P 500 Chart Book, sign up for a 14-day free trial to our Bespoke Premium research service.