The Closer — ETF Flows & Consumer Credit — 2/13/18
Log-in here if you’re a member with access to the Closer.
Looking for deeper insight on markets? In tonight’s Closer sent to Bespoke Institutional clients, we catalog ETF flows and the quarterly consumer credit data from the New York Fed.

See today’s post-market Closer and everything else Bespoke publishes by starting a 14-day free trial to Bespoke Institutional today!
This Bird is on Fire! Twitter (TWTR) Back in the Black
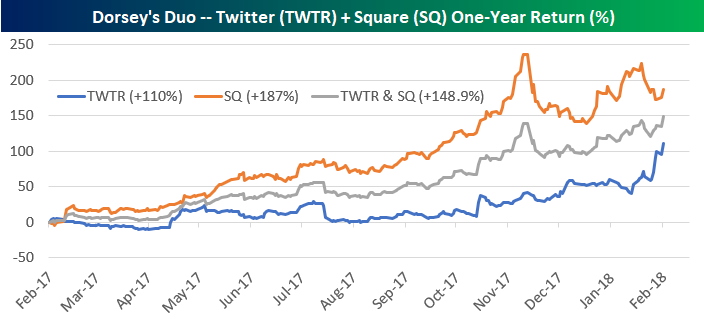
Last October we published a post titled “Dorsey’s Duo Not So Bad.” At the time, Twitter CEO Jack Dorsey was taking heat due to the company’s poor stock performance, but we pointed out in the post that Dorsey’s other company — Square (SQ) — had been performing quite well. Due to Square’s huge share price gain, “investing in Dorsey” by owning both TWTR and SQ would have resulted in triple-digit percentage gains over the past year.
Fast forward five months to today…not only has Square continued to rally, but Twitter — the social media stock that Wall Street loves to hate on — has been on fire!
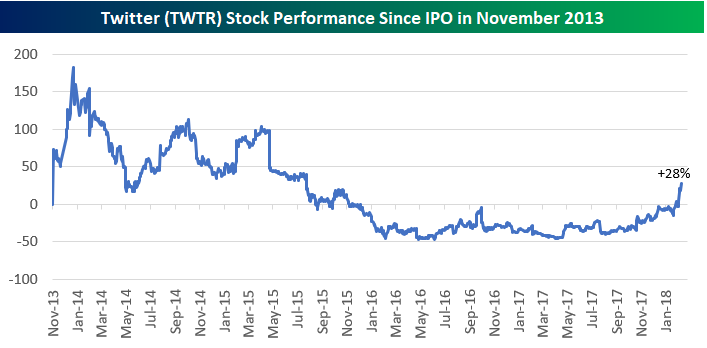
Don’t look now, but shares of Twitter are now “in the black” versus their IPO price of $26 on 11/6/13. As shown below, a surge since the start of 2018 capped by an 8% gain today has left TWTR shares up 28% versus their IPO price.
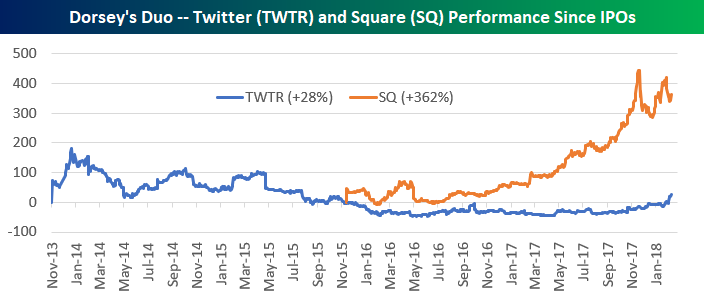
Along with TWTR’s 28% gain from its IPO, SQ is up 362% since going public in late 2015:
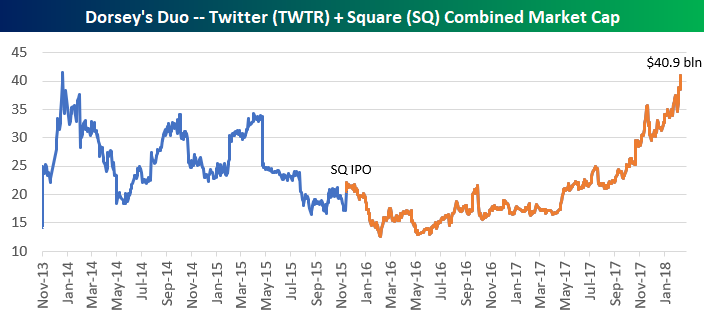
On a combined basis, Dorsey’s Duo of TWTR and SQ now have a market cap of $40.9 billion, which is up from less than $15 billion at the start of 2016.
Twitter is now up 110% year-over-year, while Square is up 187%. Had you “invested in Dorsey” by buying the same amount of both companies, you’d be up 148.9%. Not bad!
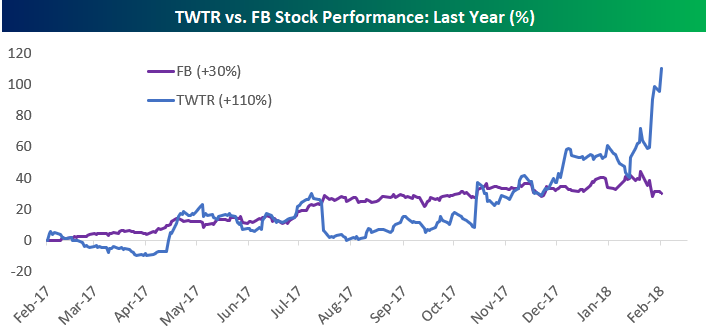
As Twitter (TWTR) has been rallying recently, its big brother in the social media space — Facebook (FB) — has stumbled a bit. While Twitter is up 39% in 2018, Facebook (FB) is down 1.9% on the year, and it’s down 10.3% over the last 8 trading days.
 Long-term Facebook (FB) shareholders still have a lot to be happy about of course. When comparing performance versus IPO prices, FB is still up more than 10x as much as TWTR. While the little blue bird is flying high right now, it still has a lot of catching up to do.
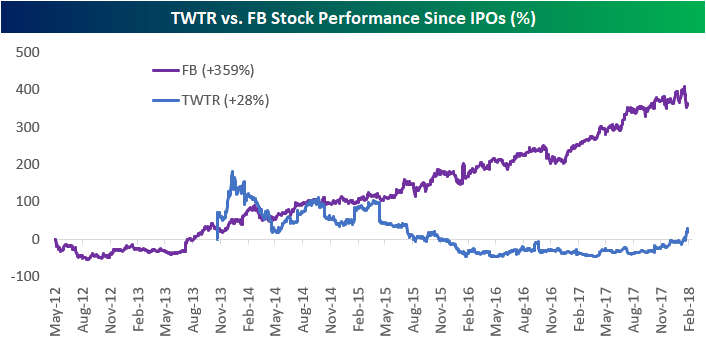
Chart of the Day: Corrections Come in All Shapes and Sizes
Bespoke’s Top Earnings Triple Plays — 2/13/18
Here at Bespoke, our job is to identify winners and losers, and one of the ways we try to find earnings-season winners is through our list of “triple plays.”
Long-term Bespoke subscribers know how much we like triple plays, but for those that haven’t heard of the term, we came up with it back in the mid-2000s for companies that beat analyst earnings estimates, beat analyst revenue estimates and also raise guidance. Investopedia.com is one of the best online resources for financial markets education, and they’ve actually given us credit for coining the “triple play” term on their website. We consider triple play stocks to be the cream of the crop of earnings season, and we are constantly finding new long-term buy opportunities from this basket of names each quarter.
Since earnings season began back in early January, there have been 99 total triple plays. That’s a high reading indicative of a healthy corporate environment, even though the S&P 500 is now in correction territory. Throughout earnings season, Bespoke Premium and Institutional members have access to our Earnings Triple Plays page, which keeps a running tally of the 100 most recent triple plays. We also publish our Top Triple Plays Report, which filters the list of most recent triple plays down to the ones with the most attractive chart patterns. We’ve just published our newest Top Triple Plays Report featuring 30 stocks with chart patterns that we like. Learn how to see the stocks below!
See our Top Earnings Season Triple Plays by signing up for a Bespoke Premium membership now. Click this link for a 14-day free trial and 30% off your first charge!
Small Business Optimism Bounces, But Still Off Recent Highs
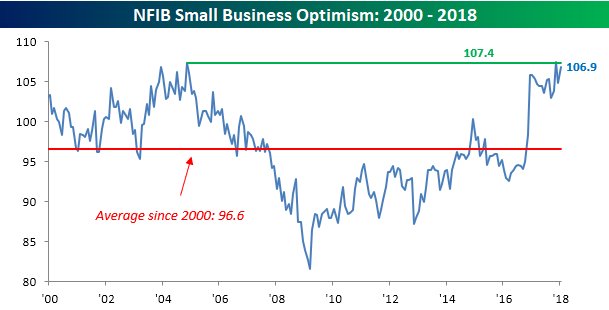
After a bit of a dip in December, sentiment on the part of small businesses rebounded in January but still came in shy of its November peak. While economists were expecting the January read of the NFIB Small Business Optimism Index to rise from 104.9 up to 105.3, the actual increase was much larger as the headline index came in at 106.9. While sentiment may be just off of recent highs, it remains well above the historical average of 96.6 since 2000.
The commentary surrounding this month’s report was positive, to say the least. According to the NFIB President and CEO, “Main Street is roaring. Small business owners are not only reporting better profits, but they’re also ready to grow and expand. The record level of enthusiasm for expansion follows a year of record-breaking optimism among small businesses.” Additionally, 32% of small business owners believe that now is a good time to expand, which is the highest level in the history of the survey dating back to 1973. According to NFIB Chief Economist Bill Dunkelberg, the reason for the big boost to confidence we have seen over the last year “is in large response to the new management in Washington tackling the biggest concerns of small business owners – high taxes and regulations.”
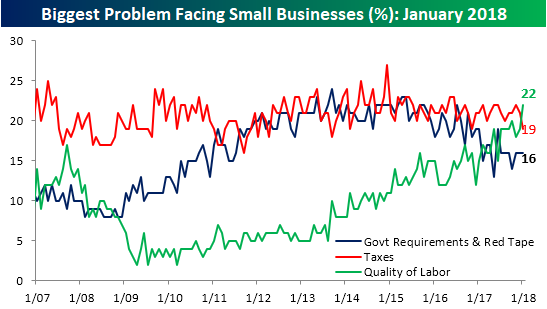
You can certainly make the case that these issues of high taxes and regulations are no longer the biggest obstacles facing small businesses. In each month’s report, the NFIB asks respondents what the number one problem they face in their business is. The table below summarizes this month’s responses compared to where they were last month. Based on January’s data, small businesses are now having the biggest problem finding qualified candidates to fill open positions with 22% citing Quality of Labor as their biggest problem. With so many businesses having trouble finding quality workers, you would expect to see labor costs rising, but so far it doesn’t seem to be that much of a problem as only 6% of small business owners cited Costs of Labor as their number one problem.

The fact that Quality of Labor moved into the top spot this month is notable for another reason. It also marks the first time in over five years that Taxes or Government/Red Tape weren’t one of the biggest problems. As shown in the chart below, while those two problems have been slowly drifting lower in the last couple of years, problems regarding Labor Quality have been surging. One would think that it is only a matter of time before the higher wages that employers will have to pay to attract quality labor will become a problem.
Bespoke Stock Scores — 2/13/18
The Closer — V For Victory? — 2/12/18
Log-in here if you’re a member with access to the Closer.
Looking for deeper insight on markets? In tonight’s Closer sent to Bespoke Institutional clients, we review the bounce in equities over the last couple of sessions.
See today’s post-market Closer and everything else Bespoke publishes by starting a 14-day free trial to Bespoke Institutional today!
Short Interest Report: 2/12/18
Tracking Multi-Year Highs in Beat Rates
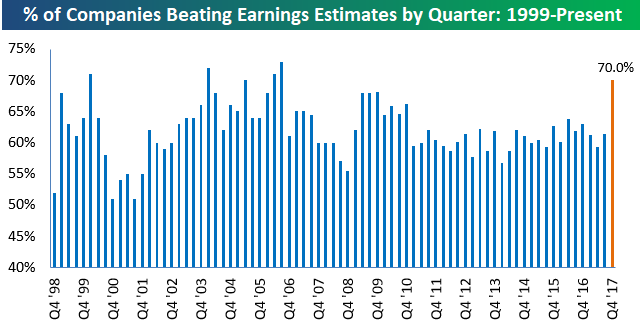
The S&P 500 just experienced its first 10%+ correction in two years right in the middle of earnings season. So how do beat rates look this earnings season? Excellent.
Even with analysts hiking their Q4 EPS estimates at the fastest rate in a decade coming into earnings season, companies have had no problem beating those estimates. Thus far, with more than 1,000 companies having reported, 70% have beaten consensus analyst EPS estimates. The 70% beat rate puts this quarter on track for the strongest bottom-line beat rate in more than ten years.
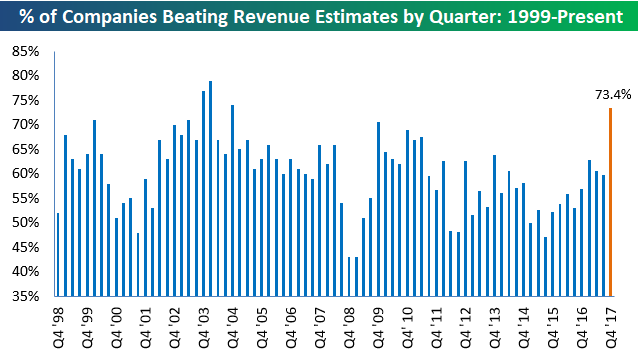
And while bottom-line numbers have been really impressive, top-line revenue beat rates have been even stronger this season. As shown below, 73.4% of companies that have reported have beaten consensus analyst revenue estimates. That’s tracking to be the strongest top-line beat rate since Q3 2004!
Again, these beat rates would be impressive in any quarter, but what makes them really stand out is that analysts were hiking estimates coming into this season, and companies have still managed to beat estimates at a very high clip. So far, analysts have not hiked estimates enough!
Two-Day Bounce
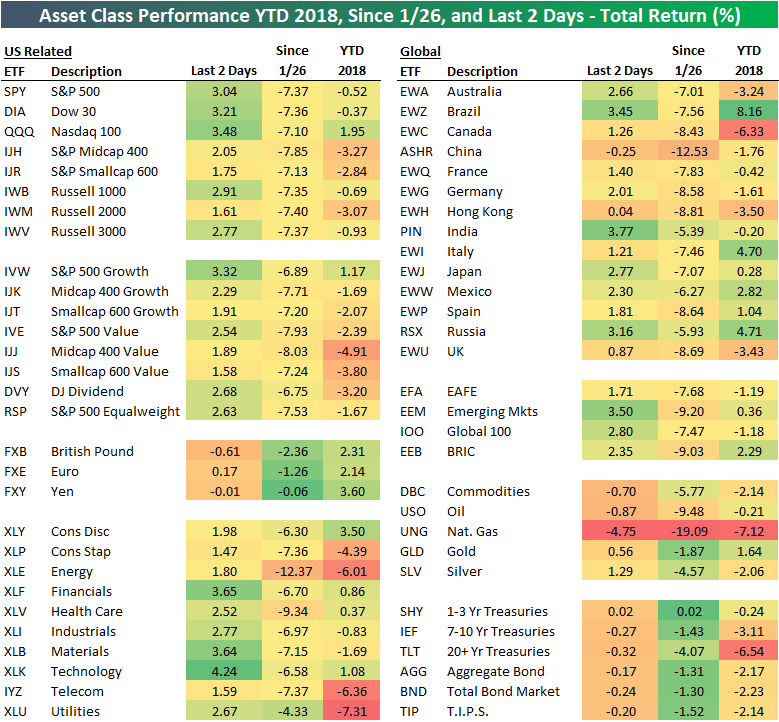
With the S&P 500 now up more than 3% since the close on Thursday, we thought it was a good time to update our asset class performance matrix to see what else has been moving the most over the past two trading days. The matrix below highlights the total return of each ETF over the last two days, since the close on 1/26 (which was the date of the S&P’s last all-time high), and year-to-date.
As shown, the Nasdaq 100 (QQQ) is up the most of the US index ETFs with a gain of 3.48%, while the small-caps (IWM, IJH) are up less than 2%. Looking at US sectors, Tech (XLK), Financials (XLF), and Materials (XLB) are up the most, while Consumer Staples (XLP), Energy (XLE), and Telecom (IYZ) are up the least.
Outside of the US, India (PIN), Brazil (EWZ), and Russia (RSX) are up the most over the last two days, while China (ASHR) is actually down and Hong Kong (EWH) is only up 4 basis points. The emerging markets ETF (EEM) has also posted a nice gain of 3.5%.
Commodities (DBC) are down by 0.70% over this period, with oil (USO) and natural gas (UNG) leading the way lower. Treasury ETFs are down slightly as well during this two-day equity rally.