Salesforce.com (CRM) Earnings After the Close
Salesforce.com (CRM) is the biggest name set to report earnings after the close today. Using our Earnings Screener, we wanted to see how CRM has typically performed on its Q4 earnings reports throughout its history as a public company. By simply entering CRM in the ticker field and then selecting Q4 as our next filter, we can easily pull up the 13 years of February earnings reports for CRM.
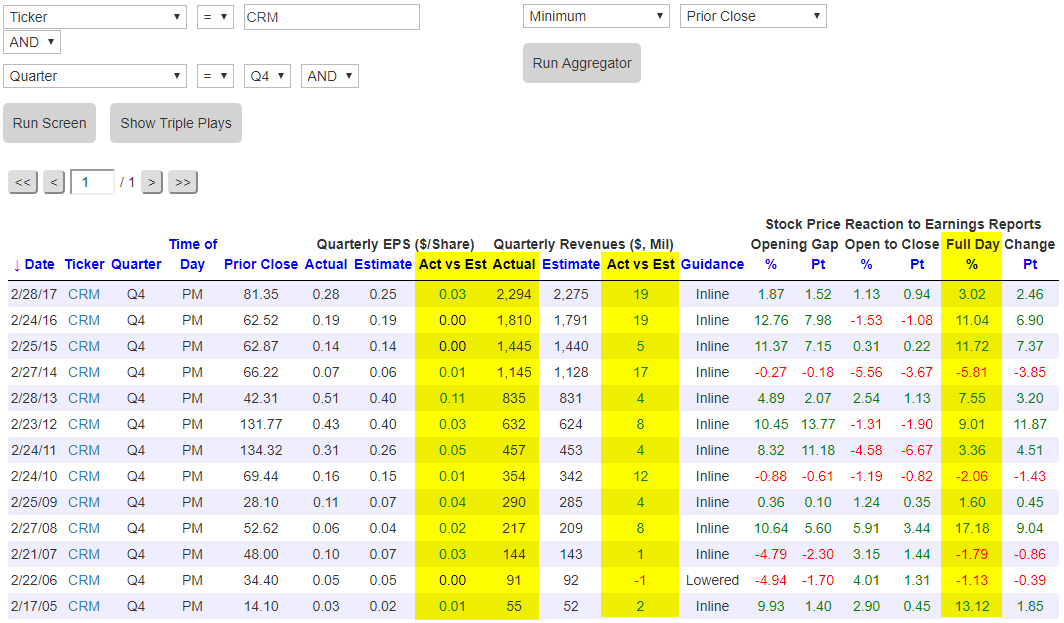
Below is a snapshot of the results that are displayed after running this earnings screen. We’ve highlighted a few columns worth pointing out.
First off, CRM has never reported weaker than expected EPS on one of its Q4 earnings releases. (In fact, it has never reported weaker than expected EPS on any of its quarterly releases!) The company has, however, posted in-line numbers quite a bit. In both 2015 and 2016, CRM’s Q4 earnings per share were right in-line with consensus estimates.
Looking at the top line, note that CRM has grown Q4 revenues on a year-over-year basis every year going back to 2005. And the company has beaten revenue estimates on its Q4 report 12 out of 13 times, with the only revenue miss coming in 2006.
Finally, salesforce’s stock price has historically done very well in reaction to its Q4 earnings report. As shown in the “Full Day % Change” column, CRM has gained on its earnings reaction day (the first trading day following its report) on 9 of its 13 Q4 reports for an average one-day change of 5.14%. Last February the stock gained 3% in reaction to its Q4 earnings report, and in 2015 and 2016, the stock gained more than 11% each time. The last time the stock fell in reaction to its Q4 report was 2014 when it dropped 5.81% on the day.
Of course, just because a stock has done something in the past doesn’t mean it will do it again in the future. It is, however, very helpful to know these types of earnings-related trends for individual stocks. While history doesn’t exactly repeat itself, it very often rhymes!
Click here for an in-depth explainer of our unique Earnings Screener tool.
B.I.G. Tips – March 2018 Seasonality
Bespoke’s March 2018 Market and Economic Indicator Calendar
Please click the image below to view our March 2018 market calendar. This calendar includes the S&P 500’s average percentage change and average intraday chart pattern for each trading day during the upcoming month. It also includes market holidays and options expiration dates plus the dates of key economic indicator releases.

Bespoke Short Interest Report: 2/28/18
Short interest figures for the middle of February were released after the close on Tuesday, so we have just updated our regular report on short interest trends for the market, sectors, and individual stocks for clients. Below we wanted to quickly highlight S&P 1500 stocks that have more than a third of their float sold short.
Through the middle of February, 17 stocks in the S&P 500 had more than a third of their float sold short, while six of those names had more than half of their float shorted. Sentiment can’t get much more negative than it is for Applied Optoelectronics (AAOI), which has nearly two-thirds of its float sold short. The negative bet has been paying off for traders again this month as the stock is down over 15%. Right behind AAOI, Big 5 Sporting Goods (BGFV) has over 61% of its float sold short, but this trade has gone against traders as the stock is up over 6% MTD. As is often the case when looking at a list of most shorted stocks, names from the Consumer Discretionary sector dominate the list with over half of the names. Of the remaining eight stocks on the list, no sector accounts for more than two names.
In terms of overall performance, the seventeen stocks listed have seen an average decline of 3.58% this month (median: -9.13%) compared to a decline of 2.39% for the S&P 1500. The fact that these stocks are underperforming even when one of them is up nearly 70% (FOSL) illustrates just how weak the rest of the stocks have been. It also doesn’t help the cause for the most shorted stocks that MiMedx (MDXG) has declined more than 55%!
For a more detailed look at short interest data on a regular basis, sign up for a monthly Bespoke Premium membership now!

Fixed Income Weekly – 2/28/18
Searching for ways to better understand the fixed income space or looking for actionable ideals in this asset class? Bespoke’s Fixed Income Weekly provides an update on rates and credit every Wednesday. We start off with a fresh piece of analysis driven by what’s in the headlines or driving the market in a given week. We then provide charts of how US Treasury futures and rates are trading, before moving on to a summary of recent fixed income ETF performance, short-term interest rates including money market funds, and a trade idea. We summarize changes and recent developments for a variety of yield curves (UST, bund, Eurodollar, US breakeven inflation and Bespoke’s Global Yield Curve) before finishing with a review of recent UST yield curve changes, spread changes for major credit products and international bonds, and 1 year return profiles for a cross section of the fixed income world.
In this week’s note, we compare return profiles for synthetic investment grade or high yield credit and the equity market.

Our Fixed Income Weekly helps investors stay on top of fixed income markets and gain new perspective on the developments in interest rates. You can sign up for a Bespoke research trial below to see this week’s report and everything else Bespoke publishes free for the next two weeks!
Click here and start a 14-day free trial to Bespoke Institutional to see our newest Fixed Income Weekly now!
Chart of the Day: Tech Sector Weighting Eclipses 25% — First Time Since 2000
Watching S&P 500 Breadth
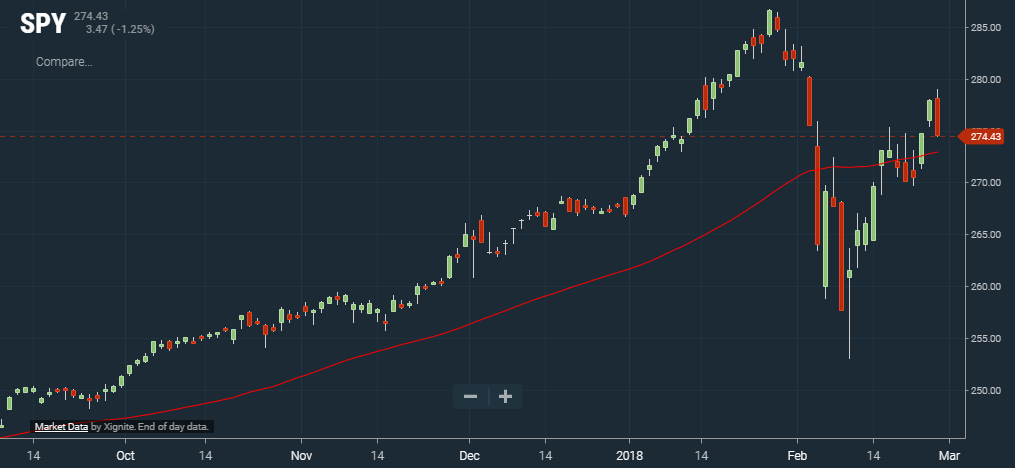
As shown in the chart below pulled from our interactive Chart Tool (available to anyone), the S&P 500 remains just above its 50-day moving average.
The percentage of stocks in the S&P 500 that are trading above their 50-day moving averages remains below the 50% mark, however, which is a sign of weak breadth relative to where the broad index is trading.
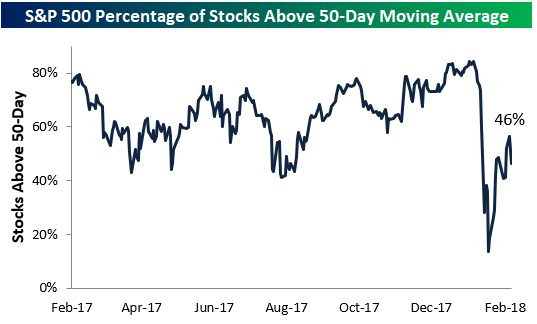
The Technology and Financial sectors — which account for roughly 40% of the S&P 500 — are keeping breadth levels for the broad market afloat. As shown below, 78% of Tech stocks are above their 50-DMAs, while 64% of Financial stocks are above their 50-DMAs. There are seven sectors that currently have weaker breadth readings than the 46% level for the S&P 500. These include sectors like Energy, Real Estate, Consumer Staples, Consumer Discretionary, and Materials.

FAANG Trend Analyzer
Our Trend Analyzer has quickly become one of the most widely used tools by Bespoke subscribers. It lets users quickly identify trend and timing trends for key ETFs across asset classes as well as for any stock in the Russell 3,000. The Trend Analyzer also includes the year-to-date change, 5-day change, and % from 50-DMA for each stock or ETF, and it lets users easily see overbought/oversold measures using our “trading range” charts.
One of the most popular features of our Trend Analyzer is the “Custom Portfolios” tab that allows users to build up to 5 custom portfolios. We built a “FAANG” portfolio that allows us to keep tabs on Facebook (FB), Apple (AAPL), Amazon (AMZN), Netflix (NFLX), and Alphabet (GOOGL).
As shown below, all five FAANG stocks are up over the last 5 trading days, with Netflix (NFLX) up the most at +4.33% and Alphabet (GOOGL) up the least at +1.26%. Amazon (AMZN) and Netflix (NFLX) have absolutely crushed it on a year-to-date basis. Netflix is already up more than 50% in 2018, while Amazon is up nearly 30%.
Looking at current trading ranges, Apple (AAPL) and Facebook (FB) have seen the biggest moves higher within their ranges over the last week, but Facebook (FB) is still just below its 50-day moving average after yesterday’s dip. AAPL, AMZN, and NFLX are in overbought territory, while FB and GOOGL are in neutral territory. GOOGL is currently the only FAANG stock that has a “good” timing score given its long-term uptrend pattern and its neutral trading level.
Set up your own custom Trend Analyzer portfolios by starting a two-week free trial to Bespoke Premium now!

Bespoke CNBC Appearance (2/28)
Bespoke co-founder Paul Hickey appeared on CNBC’s Squawk Box on Wednesday morning (2/28) to discuss markets following Tuesday’s Congressional testimony from FOMC Chair Jerome Powell. Click on the image below to view the segment.

Bespoke’s Global Macro Dashboard — 2/28/18
Bespoke’s Global Macro Dashboard is a high-level summary of 22 major economies from around the world. For each country, we provide charts of local equity market prices, relative performance versus global equities, price to earnings ratios, dividend yields, economic growth, unemployment, retail sales and industrial production growth, inflation, money supply, spot FX performance versus the dollar, policy rate, and ten year local government bond yield interest rates. The report is intended as a tool for both reference and idea generation. It’s clients’ first stop for basic background info on how a given economy is performing, and what issues are driving the narrative for that economy. The dashboard helps you get up to speed on and keep track of the basics for the most important economies around the world, informing starting points for further research and risk management. It’s published weekly every Wednesday at the Bespoke Institutional membership level.
You can access our Global Macro Dashboard by starting a 14-day free trial to Bespoke Institutional now!
