Ford Truck Sales Nearing Record Pace
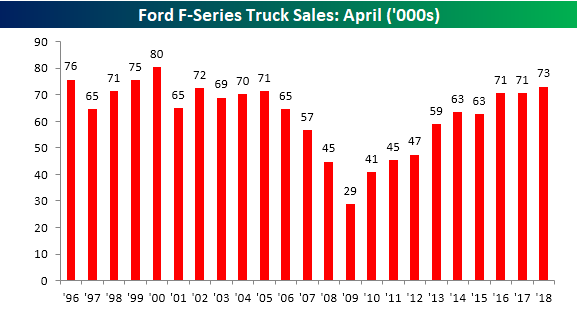
While it got lost in the shuffle of other things yesterday, we wanted to provide a quick update on the latest monthly sales figures of Ford F-Series trucks through the month of April. Sales of trucks are important for two reasons. First, as evidenced by the recent announcement by Ford that it would stop producing most car models in the North American markets and opt instead for SUVs and trucks, trucks are a higher margin ticket. More importantly, though, trucks are often purchased by small businesses and contractors, so they provide a good read on the health of the small business sector. Based on these sales totals, small businesses continue to do well. In the month of April, Ford sold 73,104 F-Series trucks, which ranks as the best April since 2000 and the fourth best since 1996.
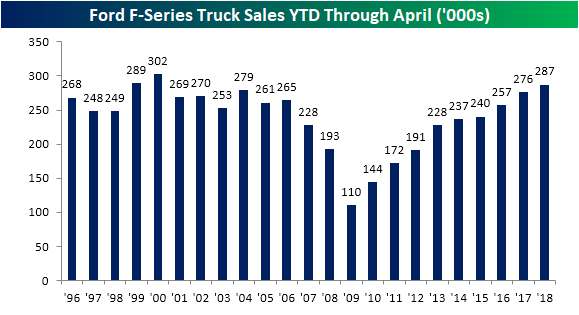
With this year’s strong showing in April, YTD sales of F-Series trucks have climbed to 287,295, and that ranks as the third-best YTD reading going back to 1996. The only two years that were stronger were 2000 and 1999. Given that this year’s total is within 2K of 1999’s total and 15K of 2000’s, if the current pace keeps up, 2018 could end up making a run for the record books!
Fixed Income Weekly – 5/2/18
Searching for ways to better understand the fixed income space or looking for actionable ideals in this asset class? Bespoke’s Fixed Income Weekly provides an update on rates and credit every Wednesday. We start off with a fresh piece of analysis driven by what’s in the headlines or driving the market in a given week. We then provide charts of how US Treasury futures and rates are trading, before moving on to a summary of recent fixed income ETF performance, short-term interest rates including money market funds, and a trade idea. We summarize changes and recent developments for a variety of yield curves (UST, bund, Eurodollar, US breakeven inflation and Bespoke’s Global Yield Curve) before finishing with a review of recent UST yield curve changes, spread changes for major credit products and international bonds, and 1 year return profiles for a cross section of the fixed income world.
This week we update the commercial mortgage backed security (CMBS) market.

Our Fixed Income Weekly helps investors stay on top of fixed income markets and gain new perspective on the developments in interest rates. You can sign up for a Bespoke research trial below to see this week’s report and everything else Bespoke publishes free for the next two weeks!
Click here and start a 14-day free trial to Bespoke Institutional to see our newest Fixed Income Weekly now!
Chart of the Day: Dollar Closes Above 200-DMA
Almost a Year in the Making: Dollar Closes Above 200-DMA
It’s been awhile, but the US Dollar Index did something today that it hasn’t done in nearly a year. As shown in the chart below, today’s rally in the greenback put the index above its 200-DMA for the first time since May 12, 2017. While the gains of over 3% in the last two weeks have been impressive, the dollar still has a lot of ground to make up before working its way out of the current downtrend. Will a hawkish Fed on Wednesday help to continue the rally or will a dovish sounding Fed stop the rally in its tracks?
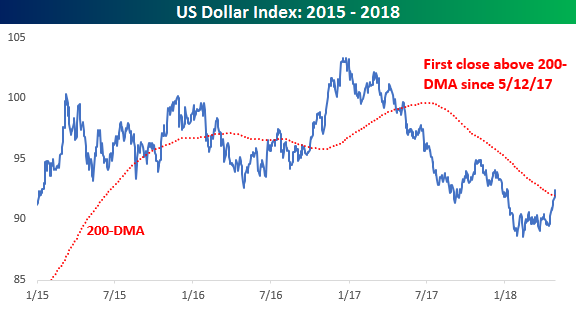
At a length of 252 trading days, the US Dollar Index’s streak of closes below the 200-DMA was the seventh longest in the history of the index dating back to 1971 and the longest since 2011 (257 trading days). The longest streak occurred back in the mid-1980s and stretched 546 trading days from May 1985 through August 1987. What was even more impressive about that streak is just two weeks after it ended another streak of 209 days started.

The Closer — Supply Chain Pressure, Slow Construction, Auto Sales & AUD — 5/1/18
Log-in here if you’re a member with access to the Closer.
Looking for deeper insight on markets? In tonight’s Closer sent to Bespoke Institutional clients, we review ISM Manufacturing, construction spending, and auto sales. We also take a look at the technical set up for the Australian dollar.

See today’s post-market Closer and everything else Bespoke publishes by starting a 14-day free trial to Bespoke Institutional today!
Chart of the Day: Market Performance on Fed Days
Bespoke Stock Scores — 5/1/18
Biggest ISM Manufacturing Disappointment in a Year
May certainly hasn’t gotten off to the best start in terms of market performance or economic data. A case in point? Today’s ISM Manufacturing report for the month of April. While economists were forecasting the headline reading to come in at a level of 58.5, the actual reading came in 1.2 points weaker at 57.3. That’s the weakest headline reading since last July and the weakest report relative to expectations since last April’s report. While the report was a disappointment, keep in mind that two months ago, the index was at its highest level since 2004.

The table below breaks down this month’s report by each of the index’s sub-components and shows their m/m and y/y change. Breadth in this month’s report was skewed to the negative side on a m/m basis, but positive on a y/y basis. Production saw the largest m/m decline, which also put it into negative territory on a y/y basis as well. On the upside, the biggest gains were in Customer Inventories and Backlog Orders.
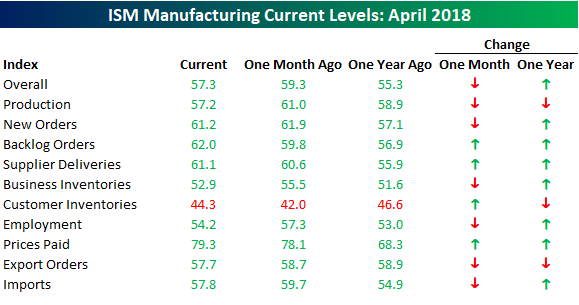
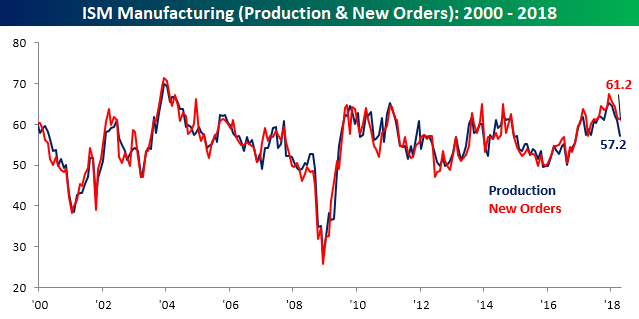
Both Production and New Orders declined this month, posting their fourth straight month of declines. The last time both components were down m/m for at least four straight months was in the period ending May 2011. Both indices remain at levels indicative of healthy growth, but they have also shown a meaningful downshift from multi-year highs.
Two indices that traded higher this month were Backlog Orders and Prices Paid. Backlog Orders hit its highest level since May 2004, while Prices Paid hit the highest level since April 2011. One surefire way to alleviate order backlogs is through higher prices, so that should support continued strength in the Prices Paid component.

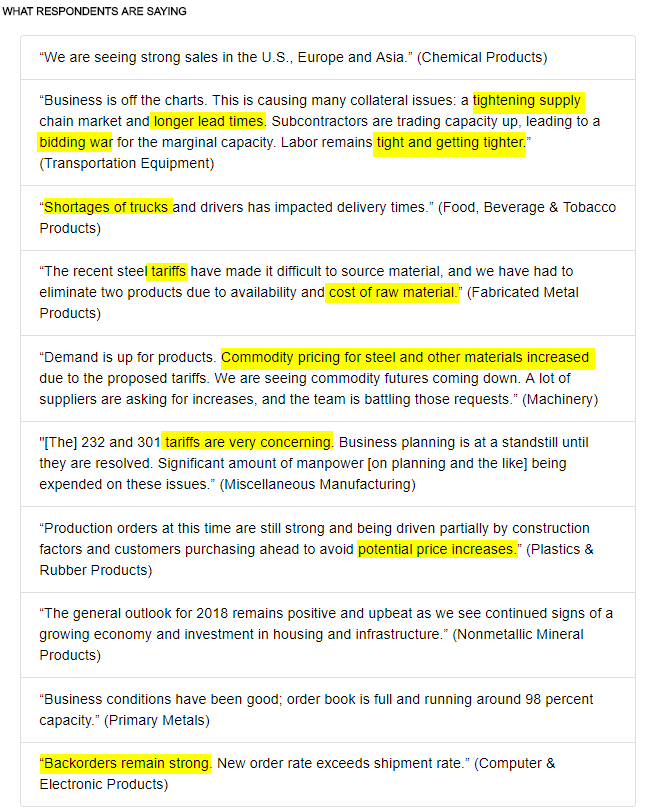
Finally, we wanted to take a quick look at the commentary section of this month’s report, and reading through it, the tone of the commentary remains positive, but one theme that runs through it is building upside price pressures. Whether it’s terms like tightening supply, longer lead times, tariffs, or shortages, one thing these factors typically always lead to is higher prices.
B.I.G. Tips – Asset Class Performance Through April; Decile Analysis
US Index ETFs All Below 50-DMAs to Start May
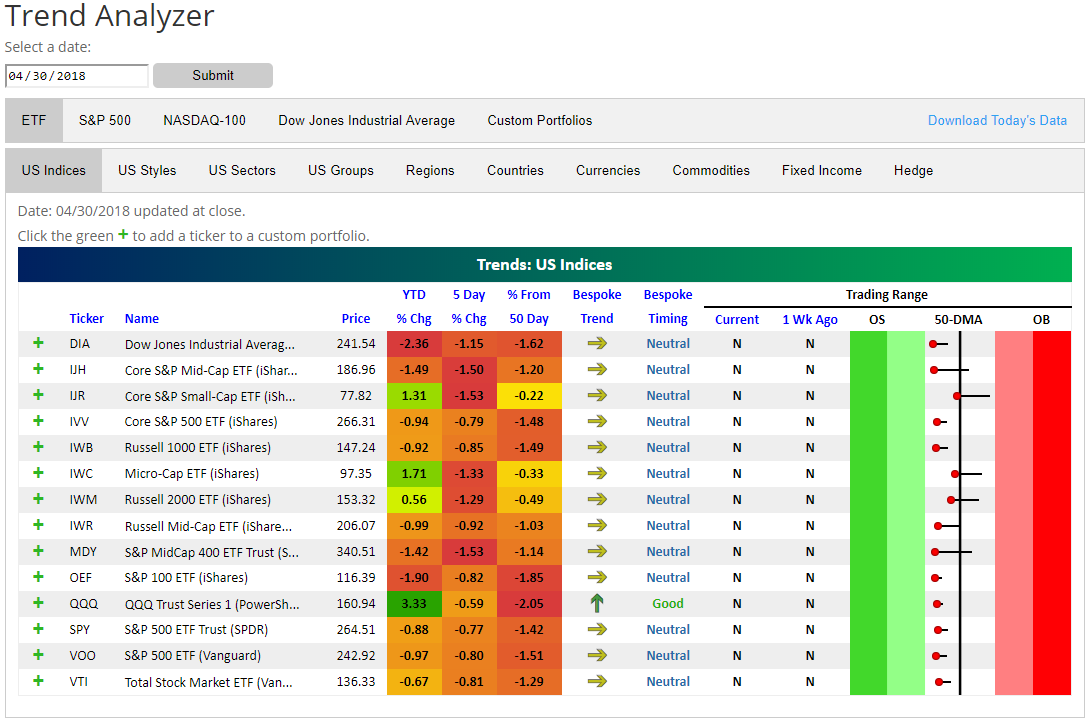
Our Trend Analyzer tool lets users easily monitor trend and timing measures of the stocks and ETFs they follow most closely. If you visit our Trend Analyzer page, the “US Index” ETF section is available to the public, but the rest of the sections (and the ability to create custom portfolios) are reserved for Bespoke subscribers.
With the month of May now upon us, we wanted to note that every single one of the US Index ETFs that we track are back below their 50-day moving averages. You can see this in the “trading range” section of the snapshot below. The dot for each ETF represents where it’s currently trading, while the tail end represents where it was trading one week ago. Also note that every single US Index ETF is in “neutral” territory, meaning it’s neither overbought nor oversold.