S&P 500’s Daily Move Back Below 1%
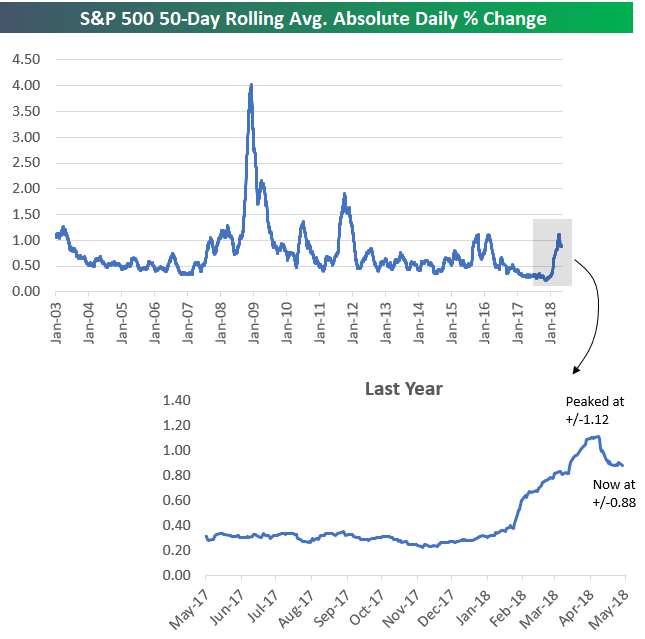
As you may have noticed, market volatility has begun to cool a bit in recent weeks. While we wouldn’t go as far as famed investor Jack Bogle did when he said recently that it’s the most volatile market he’s seen in his career, the action over the first few months of 2018 was certainly a lot more hectic than it was in 2017. At one point last year, the S&P 500’s average absolute daily % change over a 50-trading day period got as low as 0.22%! At its highs recently on April 16th, the S&P had averaged a daily absolute change of +/-1.12% over the prior 50 trading days.
Below is a chart showing the S&P’s 50-day rolling average absolute daily % change going back to 2003. The most recent period ended up trading more volatile than the action we saw in 2015/2016, but it wasn’t nearly as volatile as late 2011 when the S&P averaged a daily move of +/-1.98% over a 50-day period.
Of course, nothing since the Great Depression can compare to the volatility seen at the height of the Financial Crisis. At one point in late 2008, the S&P had averaged a DAILY move of +/-4.02% over a 50 trading day period. Now THAT is what you call “the most volatile market you’ve ever seen!”
Getting back to the current market environment, after peaking at +/-1.12% in mid-April, the S&P’s average daily change over the last 50 days has dipped down to +/-0.88%. While it may feel like things have calmed down, +/-0.88% is still 4x greater than what investors were used to in 2017.
Key Earnings Reports This Week
We’re now past the peak of the Q1 earnings reporting period, and the # of companies reporting each day will trickle lower and lower over the next few weeks. While most of the mega-cap companies that every investor pays attention to have already reported their Q1 numbers, there are still plenty of key companies that have yet to have their quarterly day in the sun (or in the storm).
Our Earnings Calendar is a very useful resource for investors looking to stay on top of quarterly earnings for the stocks they’re interested in. Users can enter specific stock tickers to find key earnings info like expected report date and time, EPS and revenue estimates, historical beat rates for EPS, revenues, and guidance, and historical stock price reactions. You can also see all earnings reports expected on a given day or during a given week over the next month.
Below is a screenshot of the Earnings Calendar showing the companies reporting this week with the largest Q1 revenue estimates. As shown, Walt Disney (DIS) is on top with estimated revenues of over $14 billion for the quarter. DIS reports tomorrow after the close, and it has historically beaten EPS estimates 80% of the time.
Some other key companies to watch this week include Anheuser-Busch InBev (BUD) on Wednesday morning, Enbridge (ENB) on Thursday morning, 21st Century Fox (FOXA) on Wednesday afternoon, and Marriot (MAR) tomorrow afternoon.
The Earnings Calendar is part of our Bespoke Premium research service. Start a two-week free trial to Bespoke Premium now for access.
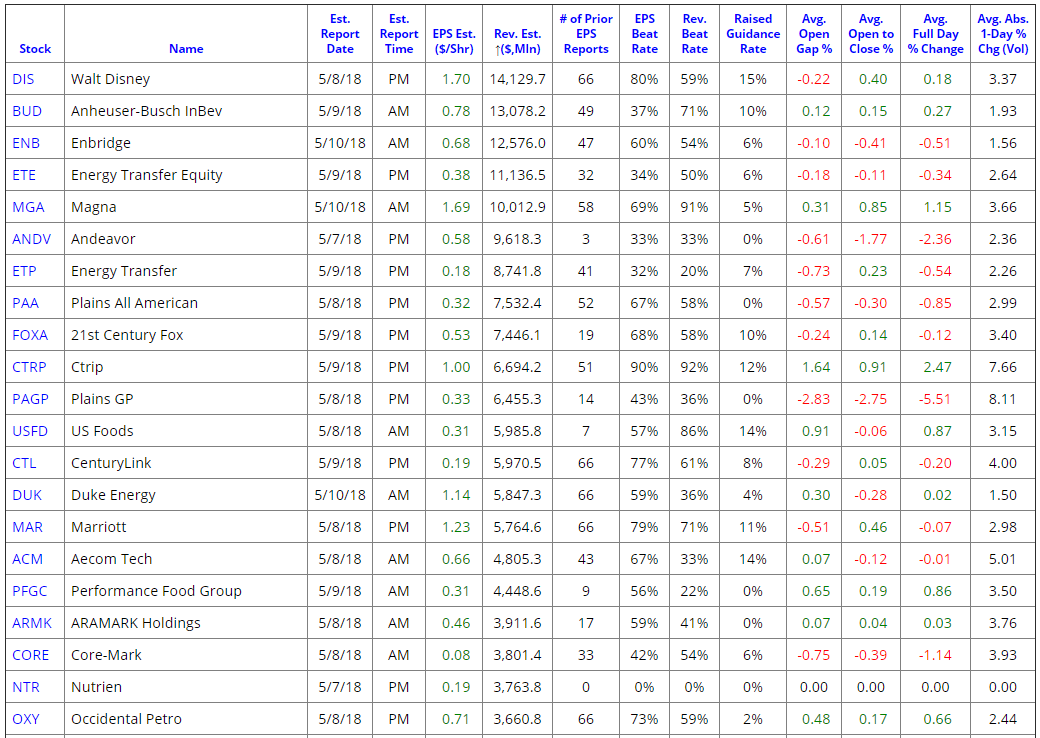
Chart of the Day: Oil Over $70 = Risk Or Opportunity?
Mixed Global Bag
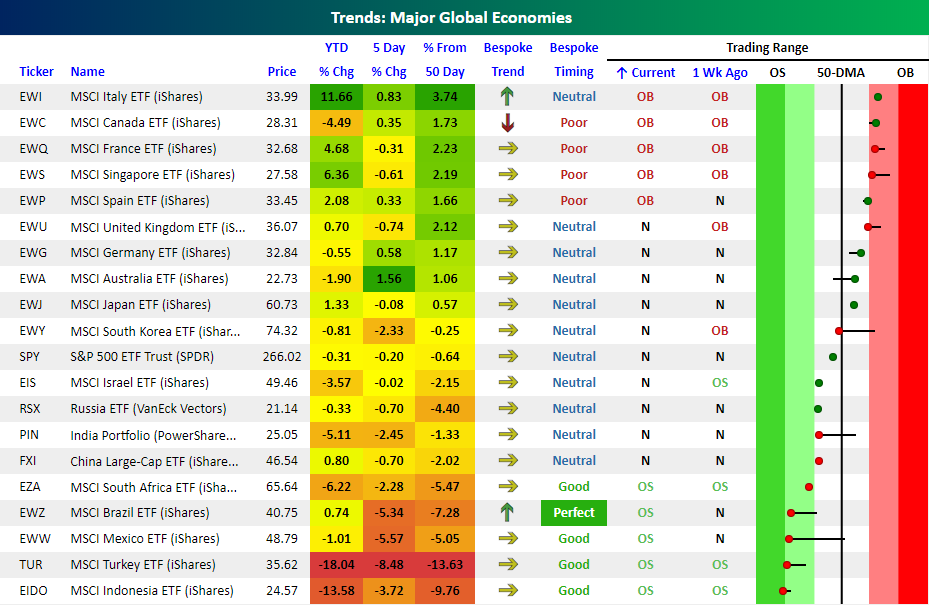
The image below is from our Trend Analyzer tool and shows a custom portfolio we created that tracks where the ETFs of the 20 largest global economies currently stand relative to their trading ranges. Keep in mind that the returns for each ETF are in US dollars and therefore account for any strength/weakness in the dollar. As shown on the right side of the snapshot, global stock markets are somewhat of a mixed bag as we enter the first full week of May. Currently, five countries are overbought (Italy, Canada, France, Singapore, and Spain), ten are neutral, and five are oversold (South Africa, Brazil, Mexico, Turkey, and Indonesia). All five overbought ETFs are from developed markets, while the five oversold ETFs are all from emerging markets, so that is one trend worth highlighting. Also worth pointing out is that of the five oversold ETFs, four have “Good” Bespoke Timing Scores, while Brazil even ranks as “Perfect”.
In terms of performance metrics, the majority of ETFs listed below are down YTD with an overall average decline of 1.4%. Leading the way to the downside are Turkey, Indonesia, South Africa, and India (again, all emerging economies), while Italy and Singapore are the only ETFs up over 5% YTD. With the S&P 500 entering the week down 0.3% YTD, it’s right in the middle of the pack versus the rest of the world and just below its 50-day moving average.
Set up your own custom Trend Analyzer portfolios by starting a two-week free trial to Bespoke Premium now!
Bespoke Brunch Reads: 5/6/18
Welcome to Bespoke Brunch Reads — a linkfest of the favorite things we read over the past week. The links are mostly market related, but there are some other interesting subjects covered as well. We hope you enjoy the food for thought as a supplement to the research we provide you during the week.
Economic Research
Income inequality in the United States: it’s flatter than you probably realize by Phillip W. Magness
A new data set suggests that previous claims about the extreme level of inequality were exaggerated by methodological issues in the ubiquitous Capital In The 21st Century. [Link]
Religious Competition And Reallocation: The Political Economy Of Secularization In The Protestant Reformation by Davide Cantoni, Jeremiah Dittmar, and Noam Yuchtman
The authors of this working paper convincingly argue that the Reformation created competition between religious elites, allowing non-religious (secular) elites to fill the gap, therefore tilting Europe towards secularization on a permanent basis. [Link; 74 page PDF]
Can an Emerging Economy Get Into Financial Trouble by Holding Too Many Foreign Assets? by Brad W. Setser (Council on Foreign Relations)
Usually, emerging markets run in to problems because they don’t have enough foreign currency-denominated assets. Taiwan may have managed to gobble down too much of a good thing. [Link]
Financial Developments
How Five Robots Replaced Seven Employees at a Swiss Bank by Stephan Kahl (Bloomberg)
A Swiss bank used a software-based solution instead of human beings to conduct a specific task; in many ways, this is what IT departments have been doing for a long time. [Link; soft paywall, auto-playing video]
Does the VIX Need Fixing? Sure Looks That Way by John M. Griffin (Bloomberg)
Deviations between the monthly settlement prices and opening prices a few seconds later suggest that the VIX is being manipulated, but the owner of the index claims the process is normal. [Link; soft paywall]
Why Americans Are Getting Paid to Invest Abroad by Mike Bird (WSJ)
High hedging costs for European and Japanese investors who want to own USD bonds mean US-based investors can earn a high return by taking the other side of the trade. [Link; paywall]
Retail
The Return of the Brick-and-Mortar Store by Conor Sen (Bloomberg)
The costs of operating an online-only retail businesses (ads, mostly) are rising, just as the costs of operating brick-and-mortar retail businesses (rent) are falling. [Link]
Nike
At Nike, Revolt Led by Women Leads to Exodus of Male Executives by Julie Creswell, Kevin Draper and Rachel Abrams (NYT)
Fed up with mistreatment and a lack of career opportunity, women at Nike conducted an anonymous survey to establish a pattern of abuse from male executives. The result was a rash of departures as the company purged offenders. [Link; soft paywall]
Emotion
Can You Overdose on Happiness? by Lone Frank (Nautilus)
Given that technology now exists to directly stimulate the human brain and produce happiness (albeit at great cost and typically only in situations where there’s a therapeutic need), we need to start thinking about what the upper limit of “healthy” happiness is. [Link]
A Bit Much
They’re now making vodka from San Francisco fog by Charles Passy (MarketWatch)
A distillery (which actually does quite a good job in their typical offerings, from what we’ve tasted) in San Francisco is now using the city’s famous fog to create vodka that is the essence of San Francisco. [Link]
Derby Days
The Gambler Who Cracked the Horse-Racing Code by Kit Chellel (Bloomberg)
A dive inside the shadowy world of professional horse race gambling, including the story of the men tha correctly predicted a trifecta (the top three finishers, in order) in three consecutive races. [Link; soft paywall]
Alphabet
Evolution of the English Alphabet by Matt Baker (Useful Charts)
A set of charts designed to show how the earliest written alphabets slowly evolved into the modern English alphabet. [Link]
Read Bespoke’s most actionable market research by starting a two-week free trial today! Get started here.
Have a great Sunday!
The Bespoke Report Newsletter — 5/4/18
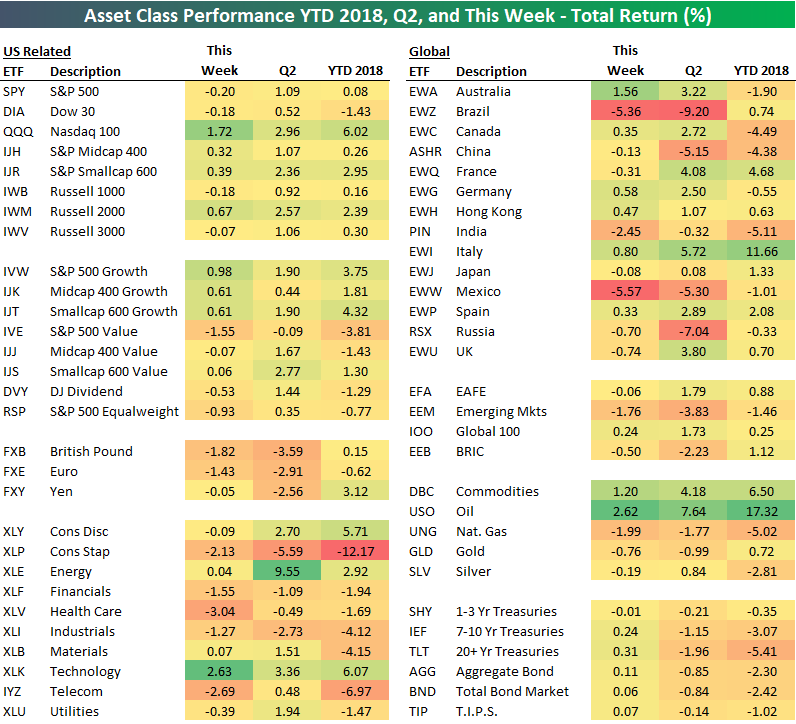
While the S&P 500-tracking SPY ETF fell 20 basis points on the week, the Nasdaq 100 (QQQ) rallied 1.72%. Looking at sectors, most fell, while Tech (XLK) was the only area of strength with a gain of 2.63%.
Outside of the US, both Brazil (EWZ) and Mexico (EWW) fell 5%+, while Australia (EWA) was the only country to gain more than 1%. And while oil (USO) rallied, gold (GLD) and silver (SLV) declined.
We’ve just published our weekly Bespoke Report newsletter, which provides an in-depth review of recent market action and events. In this week’s report, we also provide two lists of stocks we think look attractive. One list looks at top earnings plays, while the other looks at “domestic” stocks with attractive chart patterns. To read this week’s Bespoke Report, start a two-week free trial by clicking the button below.
The Closer: End of Week Charts — 5/4/18
Looking for deeper insight on global markets and economics? In tonight’s Closer sent to Bespoke clients, we recap weekly price action in major asset classes, update economic surprise index data for major economies, chart the weekly Commitment of Traders report from the CFTC, and provide our normal nightly update on ETF performance, volume and price movers, and the Bespoke Market Timing Model. We’ve recently added a section that helps break down momentum in developed market foreign exchange crosses as well.
Below is a snapshot from today’s Closer highlighting weekly intraday price charts for major equity indices and other asset classes. If you’d like to see more, start a free trial below.

The Closer is one of our most popular reports, and you can sign up for a free trial below to see it!
See tonight’s Closer by starting a two-week free trial to Bespoke Institutional now!
FANGs: More Lives Than a Cat
Can a group of stocks be any more resilient than the FANG stocks? It seems like any time the stocks in this group have their backs against the ropes, they come bouncing back. It happened again this week when a very poor start quickly turned around. Adding even more irony to the story — who would have thought that Warren Buffett would have a hand in providing a boost to the group!
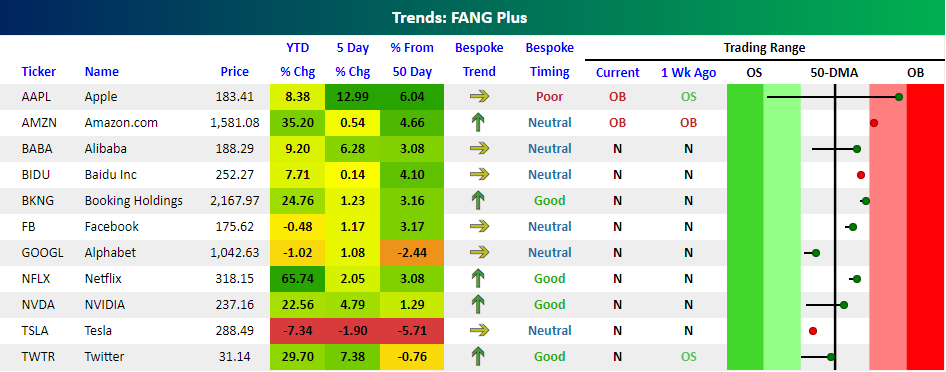
The graph below is from our Trend Analyzer tool and shows the current levels of the stocks that make up the FANG+ Index using the Custom Portfolio feature of this tool. Led by Apple (AAPL), after Warren Buffett told CNBC that he purchased an additional 75 million shares of the stock during the first quarter, the FANG+ stocks had a monster week, rising an average of 3.25% with every stock besides Tesla (TSLA) in the green. Forget about TSLA, though, because who has time for “boring, boneheaded” stocks that go down anyways? Besides AAPL, Twitter (TWTR) and Alibaba (BABA) also had strong weeks with gains of 7.4% and 6.3%, respectively.
The only three stocks in the FANG+ index that are below their 50-DMAs are Alphabet (GOOGL), TSLA, and TWTR. Of these three stocks, the weakness in GOOGL is probably the most surprising. Along with Facebook (FB), the company has a near monopoly with a lot less of the baggage, yet while FB is still up YTD, GOOGL is down by over 2% and underperforming every single stock in the FANG+ group except for TSLA.
When it comes to their trading ranges, after AAPL moved from deeply oversold territory to very overbought in the span of a week, its “Timing” score is the only one in the group that is classified as Poor, while Booking (BKNG), Netflix (NFLX), and NVIDIA (NVDA) all still have Good Timing scores.
The Closer — No Resolution Yet — 5/3/18
Log-in here if you’re a member with access to the Closer.
Looking for deeper insight on markets? In tonight’s Closer sent to Bespoke Institutional clients, we discuss the technical set-up for the S&P 500 along with economic data released today in the United States.

See today’s post-market Closer and everything else Bespoke publishes by starting a 14-day free trial to Bespoke Institutional today!