The Closer: End of Week Charts — 4/20/18
Looking for deeper insight on global markets and economics? In tonight’s Closer sent to Bespoke clients, we recap weekly price action in major asset classes, update economic surprise index data for major economies, chart the weekly Commitment of Traders report from the CFTC, and provide our normal nightly update on ETF performance, volume and price movers, and the Bespoke Market Timing Model. We’ve recently added a section that helps break down momentum in developed market foreign exchange crosses as well.
Below is a snapshot from today’s Closer highlighting weekly intraday price charts for major equity indices and other asset classes. If you’d like to see more, start a free trial below.

The Closer is one of our most popular reports, and you can sign up for a free trial below to see it!
See tonight’s Closer by starting a two-week free trial to Bespoke Institutional now!
The Bespoke Report — 4/20/18
Group Breadth Leaning Weak
Two days ago, the percentage of S&P 500 Industry Groups trading above their 50-DMAs reached 66.6%, which was a huge improvement from the 0% reading we saw back in late March. Over the last two days, we’ve seen this percentage dip back below 50% just as the S&P 500 did the same today. At the surface, breadth in individual groups appears to be tracking the S&P 500 pretty closely.
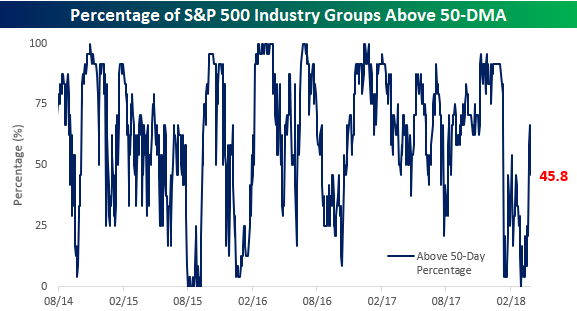
Looking a little more closely, though, breadth isn’t as solid as it may seem. The table below shows each of the 24 S&P 500 Industry Groups and how they’ve performed YTD as well as where they are trading relative to their 50-DMAs. Note in this table that although 11 out of 24 Industry Groups are above their 50-DMAs, many of them are hanging on by a thread. For example, three of the Industry Groups (Materials, Div Financials, and Software and Services) are less than 0.1% above their 50-DMAs and another two are less than 1% above that level. In this current market environment, it wouldn’t take much of a decline to send all five of these Industry Groups back below their 50-DMAs. In fact, the only Industry Group that would be immune to a one-day sell-off dragging it below its own 50-DMA is Energy! On the flipside, the only Industry Group currently below its 50-DMA that is within a percent of getting back above that level is Capital Goods (-0.18%). In other words, while it wouldn’t take much of a decline to make this breadth reading look really bad, it would take a pretty sizable rally to make it look good.
In terms of YTD performance, just eight Industry Groups are in the green for the year as of now, while twice that number are down on the year. The biggest losers by far are both from the Consumer Staples sector. The Household and Personal Products group is down a whopping 14.9% on the year already, while Food Beverage & Tobacco stocks are down over 12%. Perhaps the irony of all ironies this year is that the Retailing Group is up 14.6% YTD. Before anyone starts thinking retail stocks are seeing some sort of renaissance, keep in mind that practically all of the gains in the group are the result of Amazon.com (AMZN), which is up 31% YTD and Netflix (NFLX), which is up over 70%. Besides these two big winners, the average YTD performance of stocks in the Retailing group is a decline of over 3%.

Earnings & Economic Surprises
Earnings beat rates have been very strong recently. In the 12 weeks ending February 16th, 69.1% of companies beat EPS, and over 72% of companies beat on revenues. These numbers have moderated somewhat since then but still remain extremely strong (65.8% and 70.2% respectively). For EPS, recent levels of beat rates on a rolling 12 week basis have been the strongest since the aftermath of the last recession. Revenue beat rates have been dramatically stronger, with the best beat rate since 2004. It shouldn’t be surprising that economic data has also been very strong relative to expectations. In the charts below, we show the rolling 12 week beat rates for EPS and revenues, versus the 12 week rolling average of the Citi Economic Surprise Index for the United States. As the charts show, while the correlation between these two related indicators of strong results versus expectations aren’t perfectly correlated, they do tend to move together over time. One note of caution: the Citi Economic Surprise index has continued to pull back in recent weeks, and is currently at the lowest levels since October of 2017. That suggests that the stellar beat rates of last earnings season won’t repeat as this earnings season heats up, though they are likely to remain pretty strong given the first few reports we’ve gotten.
The Closer — Expensive Earnings Yield, US Data Round Up, FX Stories — 4/19/18
Log-in here if you’re a member with access to the Closer.
Looking for deeper insight on markets? In tonight’s Closer sent to Bespoke Institutional clients, we review S&P 500 valuation relative to interest rates. We also discuss US data released today and a series of interesting developments in FX.

See today’s post-market Closer and everything else Bespoke publishes by starting a 14-day free trial to Bespoke Institutional today!
Bespoke’s Sector Snapshot — 4/19/18
We’ve just released our weekly Sector Snapshot report (see a sample here) for Bespoke Premium and Bespoke Institutional members. Please log-in here to view the report if you’re already a member. If you’re not yet a subscriber and would like to see the report, please start a two-week free trial to Bespoke Premium now.
Below is one of the many charts included in this week’s Sector Snapshot, which highlights the percentage of stocks in each S&P 500 sector that are trading above their 50-day moving averages. While the reading for the broad S&P 500 is back above 50%, the readings for the two largest sectors of the market — Technology and Financials — are at 50% or lower.
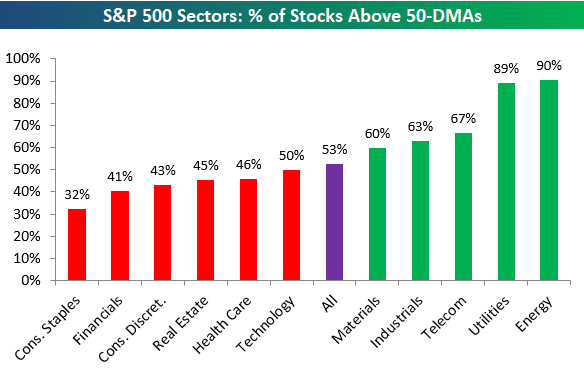
To find out what this means and to see our full Sector Snapshot with additional commentary plus six pages of charts that include analysis of valuations, breadth, technicals, and relative strength, start a two-week free trial to our Bespoke Premium package now. Here’s a breakdown of the products you’ll receive.
Chart of the Day: Fed Cuts Priced?
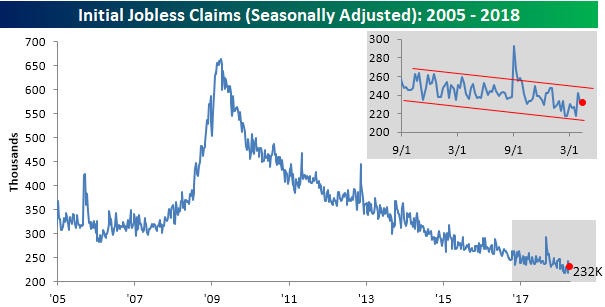
Jobless Claims Little Changed
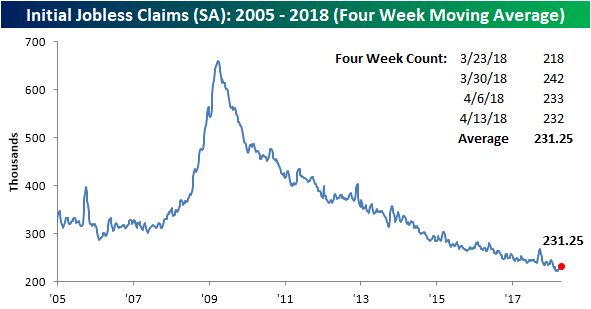
Jobless claims dropped a “whopping” 1K in the latest week and missed expectations by a margin of just 2K. In other words, little changed in the overall trend of claims. For the week, first-time claims came in at 232K. This is the 28th straight week that claims have been at or below 250K, and extends the record of consecutive weeks below 300K to 163.
The four-week average for claims rose by just over 1K this week to 231.25K, and remains within 10K of the multi-decade low of 222.75K from early March.
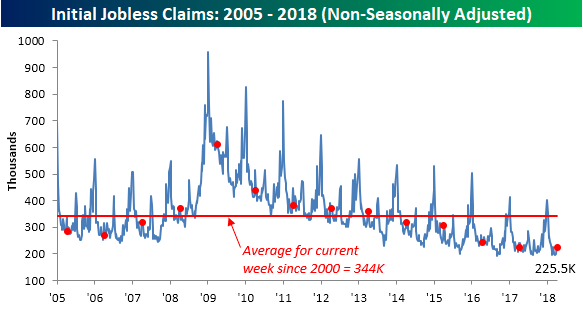
At 225.5K, non-seasonally adjusted claims haven’t been this low in the current week of the calendar since 1973. Going back to 2000, the average for the current week of the year has been 344.3K, so this week’s level is nearly 120K below that.
A Slight Beat for the Philly Fed
The Philadelphia Fed’s monthly report on manufacturing came in slightly better than expected for April. While economists were expecting a slight decline to 21.0 from last month’s reading of 22.3, the actual reading showed a slight increase to 23.2. From a bigger picture perspective, the headline report has been positive for 23 straight months now, which is the longest streak since August 2015. Even more impressive, though, is the fact that the last 17 of those monthly reading have been above 20, and that’s tied with the period ending in June 1984 for the longest streak in the history of the survey.

Looking at the individual components of this month’s report, there were some sizable declines in New Orders, Shipments, Unfilled Orders, and Inventories.
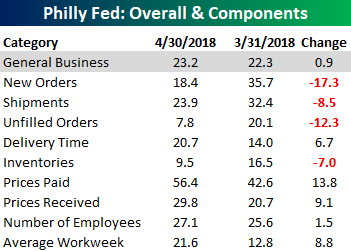
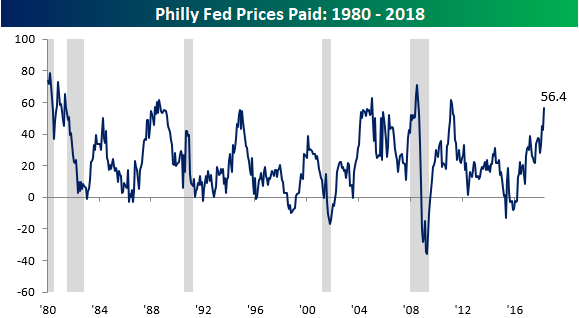
On the upside, Prices Paid had its largest one month increase since November 2016 and rose to its highest level since March 2011.
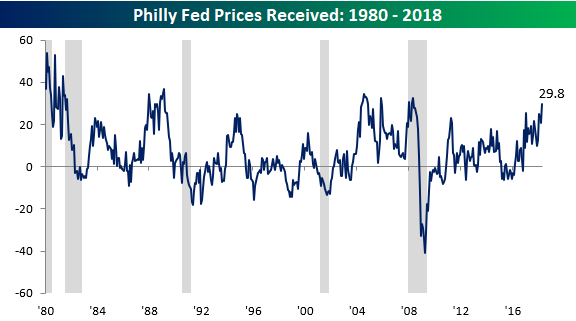
Prices Received also had a relatively large increase and is now at its highest level since early 2008!
But it wasn’t just the increases in these two components pointing to inflationary implications. Delivery Times also hit a record high, which suggests demand is outstripping supply.

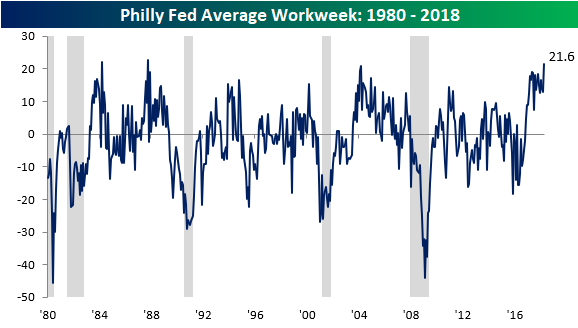
Also, Average Workweek increased to 21.6, which is the highest level since October 1987! While extending workweeks can work temporarily, eventually, that should lead to more hiring and higher costs.
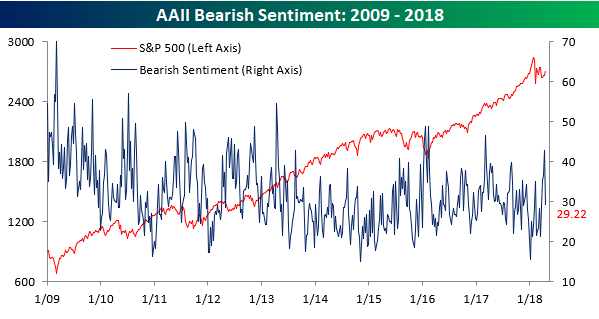
Individual Investor Whiplash
With all the volatility in the equity market lately, it is only natural that investors are having a hard time figuring out what to do. That confusion is clearly starting to show up in surveys of sentiment like the weekly AAII poll. In last week’s update on sentiment, we noted that the percentage of bullish investors had dropped all the way down to 26%, which was the lowest level since last August. Well, in this week’s survey sentiment spiked back up to 37.8%, for an increase of 11.7 percentage points. That’s the largest one week increase since last September. Isn’t it amazing what a few up days for equities can do to sentiment? That said, we would note that these sort of sentiment shifts based solely on the day to day moves of the market isn’t particularly healthy.
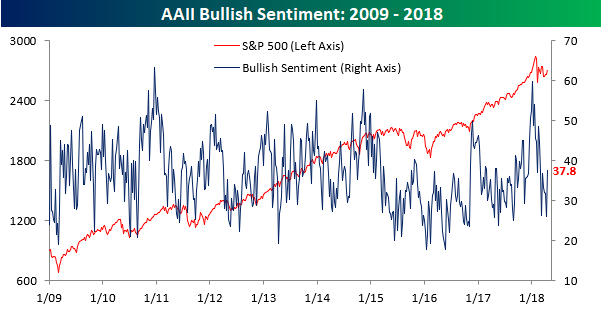
With the big spike higher in bullish sentiment, bearish sentiment tanked, falling from 42.75% down to 29.22%. Besides a similar one week decline following the initial bounce in sentiment in February, the last time we saw a larger one-week decline in bullish sentiment was back in the first week of 2012!