S&P 1500 Misfit Stocks
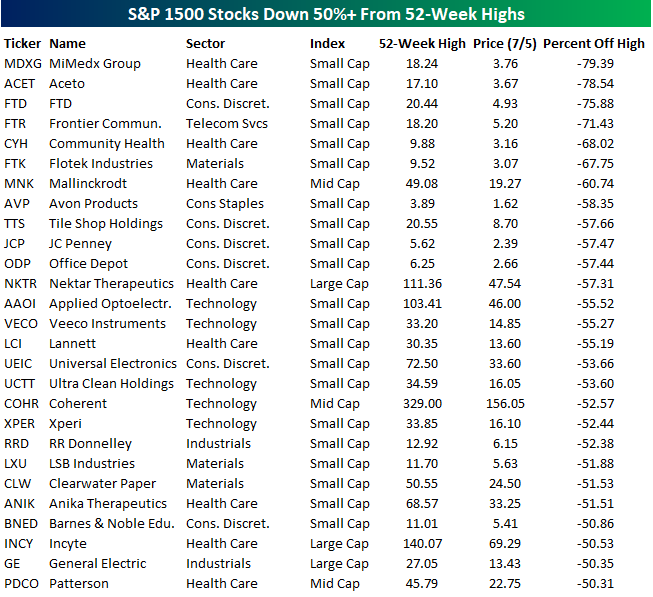
Earlier today, we summarized how far individual stocks in the S&P 1500 were trading from their 52-week highs based on sectors and market cap. In the table below, we wanted to highlight which stocks have been the biggest drags on their peer groups. The 27 stocks listed below are all down 50% or more from their respective 52-week highs. Leading the way to the downside, shares of MiMedx (MDXG) have plummetted close to 80% as that company deals with financial restatements (to put it mildly) and what some consider a potential bankruptcy filing. Behind MDXG, another five small-cap stocks lead the list of biggest losers, and all of them have lost at least two-thirds of their value.
The first non-small cap stock on the list is generic drug maker Mallinkrodt (MNK), which at just under $20 per share is down over 60%. From MNK’s position at number seven, we have to go down another five to find the first large-cap stock on the list (Nektar Therapeutics: NKTR). The story of NKTR is one of tough timing for the S&P 500. The stock was added to the index back in March when it was trading at $105. From there, though, it’s been all downhill as the stock has lost more than half of its value after releasing disappointing trial data at this year’s ASCO conference. Going further down the line, the most notable stock listed is General Electric (GE). Things haven’t exactly been going well lately for “the house that Jack (Welch) built.” As if losing more than half of its value wasn’t bad enough, the stock was also just booted from the DJIA.
In terms of sector and market cap breakdown, the majority of the stocks listed are from the S&P 600 Small Cap Index. While small caps are often an area of the market where investors look to find winners that will turn into large caps, it’s also often the last stop for former large and mid-cap companies that have fallen on hard times. In terms of sector breakdowns, seven of the eleven S&P 500 sectors are represented. Health Care has the most misfits and accounts for a full one-third of the names on the list. Behind Health Care, Consumer Discretionary accounts for six stocks, while another five are from the Technology sector.
Average Stock Declines From Their 52-Week Highs
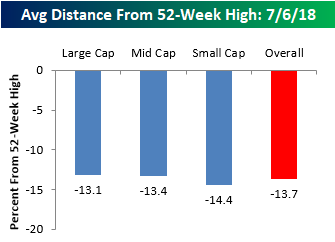
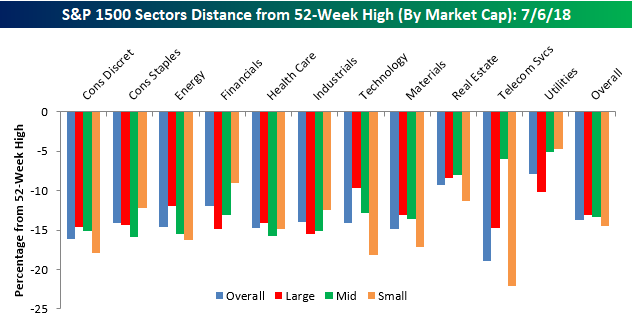
In a tweet yesterday, we noted that the S&P 500 was trading right at the exact mid-point of its 2018 closing high and closing low, putting the index about 5% below its 52-week high. While that’s a relatively modest decline, stocks in the S&P 1500, which includes large, mid, and small caps, are down an average of 13.7% from their respective 52-week highs. Before we all go and start talking about how these numbers suggest much weaker internals than the overall market averages suggest, keep in mind that not all stocks hit their own highs simultaneously with the market. Therefore, this reading is always weaker than the overall reading for the S&P 500. In fact, even when the S&P 500 was hitting highs earlier this year, the average stock in the index was down in the mid to high single-digits.
What is interesting to note about current levels is how uniform they are across each market cap range. Between the average large cap, which is down 13.1% from its high, and the average small cap, which is down 14.4%, only 1.3 percentage points separates the two. Normally the gap is much wider (with small caps usually down much more), but with small cap domestically focused stocks outperforming recently, the gap has narrowed.
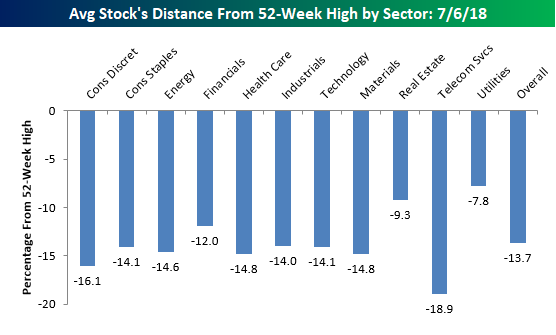
In terms of average stock declines by sector, the handful of stocks in the Telecom Services sector are down the most with an average decline of 18.9% from their respective highs. Behind that sector, you may be surprised to see that the next weakest sector based on this measure is Consumer Discretionary, where the average stock is down over 16%. Consumer Discretionary has been one of the better performing sectors this year with a gain of 11%. A lot of that strength, however, is the result of big gains in Amazon.com (AMZN) and Netflix (NFLX), which have large weightings in the market cap weighted sector performance. Among smaller cap names in the sector, the picture isn’t quite as strong.
Sectors holding up the best relative to their highs are Utilities (-7.8%) and Real Estate (-9.3%). These are the only two sectors where the average stock is down less than 10%, and that’s largely due to the fact that both sectors are defensive and not very volatile by nature. Stocks in these two sectors may well be holding up the best, but both sectors are actually underperforming the S&P 500 YTD.
Finally, our last chart breaks down the average decline from a 52-week high by sector and market cap. Here there are some interesting divergences. We already mentioned the Consumer Discretionary sector above, but a similar dynamic is playing out in Energy, and even more so in Technology. Within the Technology sector, the average decline from a 52-week high among large caps is less than 10%, while the average decline for a small cap is more than twice that at 18.2%. Besides small cap tech, the only group weaker has been small cap Telecom Services, which is made up of just eight stocks compared to 95 for the small cap Technology sector.
While large caps are holding up a lot better than small caps in many sectors, we have seen the opposite pattern play out in the Financials sector. All we seem to hear this year is how Financials have been so weak, and while that may be true among large cap Financials which are down an average 14%+ from their highs, small cap Financials are down less than 10%.
The Closer — EIA, Mexico Post-Election Rally, EM Turning Around? — 7/3/18
Log-in here if you’re a member with access to the Closer.
Looking for deeper insight on markets? In tonight’s Closer sent to Bespoke Institutional clients, we take a look at EM. Mexican assets have surged in the wake of last weekend’s election, with the MSCI Mexico ETF (EWW) up 7.5% in the past two days. Other EM assets are starting to join that party. We also discuss a weaker than forecast EIA data on petroleum markets that sent crude lower but products higher.

See today’s post-market Closer and everything else Bespoke publishes by starting a 14-day free trial to Bespoke Institutional today!
B.I.G. Tips – June Employment Report Preview
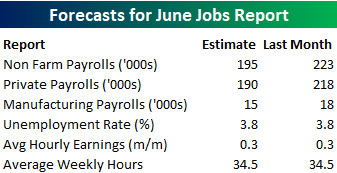
Heading into Friday’s Non-Farm Payrolls (NFP) report for June, economists are expecting an increase in payrolls of 195K, which would be a modest decline from May’s solid reading of 223K. In the private sector, economists are expecting an increase of 195K. With these increases, the unemployment rate is expected to remain low at 3.8%. An added area of focus, however, will come from average hourly earnings as inflation worries weigh on investor sentiment. Any stronger than expected reading in wage measures will likely be viewed as a negative for the market
Ahead of the report, we just published our eleven-page preview of the June jobs report. This report contains a ton of analysis related to how the equity market has historically reacted to the monthly jobs report, as well as how secondary employment-related indicators we track looked in June. We also include a breakdown of how the initial reading for June typically comes in relative to expectations and how that ranks versus other months.
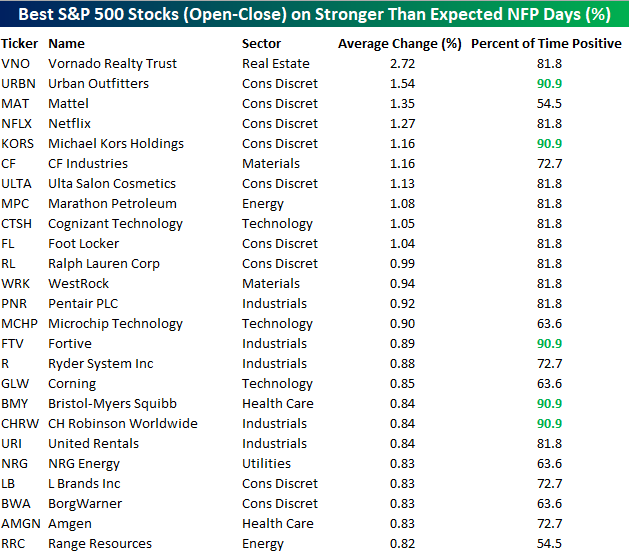
One topic we cover in each month’s report is the S&P 500 stocks that do best and worst from the open to close on the day of the employment report based on whether or not the report comes in stronger or weaker than expected. In other words, which stocks should you buy, and which should you avoid? The table below highlights the best-performing stocks in the S&P 500 from the open to close on days when the Non-Farm Payrolls report has been better than expected over the last two years.
Of the 25 top performing stocks on days when the NFP beats expectations, eight sectors are represented, and Consumer Discretionary leads the way with nine. Vornado (VNO) has been the best performing stock with an average open to close gain of 2.72%. VNO is followed by nine other stocks that have been up over 1%. In terms of consistency, Urban Outfitters (URBN), Michael Kors (KORS), Fortive (FTV), Bristol Myers (BMY), and CH Robinson (CHRW) have all been positive 90% of the time.
For anyone with more than a passing interest in how equities are impacted by economic data, this report is a must-read. To see the report, sign up for a monthly Bespoke Premium membership now!
Bespoke Consumer Pulse Report — June 2018
Bespoke’s Consumer Pulse Report is an analysis of a huge consumer survey that we run each month. Our goal with this survey is to track trends across the economic and financial landscape in the US. Using the results from our proprietary monthly survey, we dissect and analyze all of the data and publish the Consumer Pulse Report, which we sell access to on a subscription basis. Sign up for a 30-day free trial to our Bespoke Consumer Pulse subscription service. With a trial, you’ll get coverage of consumer electronics, social media, streaming media, retail, autos, and much more. The report also has numerous proprietary US economic data points that are extremely timely and useful for investors.
We’ve just released our most recent monthly report to Pulse subscribers, and it’s definitely worth the read if you’re curious about the health of the consumer in year two of Trump’s economy. Start a 30-day free trial for a full breakdown of all of our proprietary Pulse economic indicators.

A Pretty Weak “Stronger Than Expected” ISM Services Report
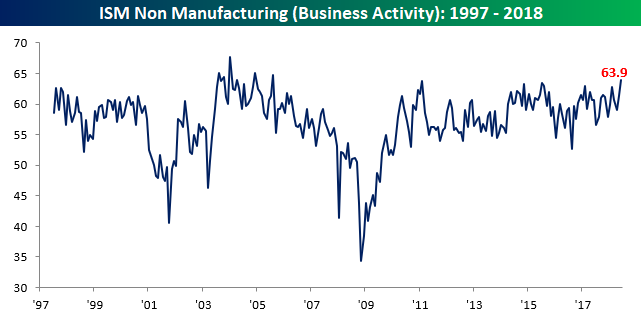
Today’s release of the ISM Services report for the month of June came in stronger than expected at the headline level, but the internals of the report were somewhat weak. While economists were expecting the headline number to come in at 58.3, the actual reading was 59.1, which was the highest monthly reading since February. On a combined basis and accounting for each sector’s overall weight in the economy, our June composite ISM came in at 59.2.

While the headline reading for the June ISM Services report increased on a month over month basis, seven of the report’s ten subcomponents declined relative to May. The last time that happened was in July 2010. The only categories that increased were Business Activity, New Orders, and Export Orders.
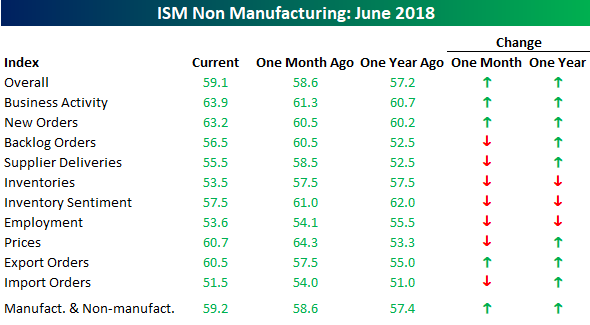
The pickup in Business Activity was a particular standout as that component surged to 63.9, which is its highest reading since August 2005.
With the June Non Farm Payrolls report on deck for tomorrow, it is worth noting that the Employment component of this month’s ISM Services report fell from 54.1 down to 53.6. While that’s a pretty modest decline, that component has been steadily declining for a number of months now.

Chart of the Day: Lenders Loafing
Jobless Claims Slightly Higher Than Expected
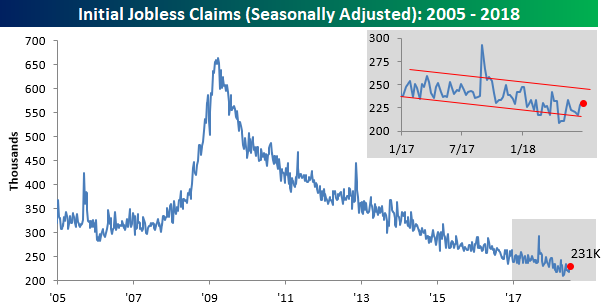
Jobless claims for the latest week came in at 231K, which was slightly higher than the consensus expectation of 225K. Even at that level, though, claims remain at ridiculously low levels relative to history. This week’s reading not only represents a record 174 straight weeks where claims have been below 300K, but also the 39th straight week where claims have been at 250K or below.
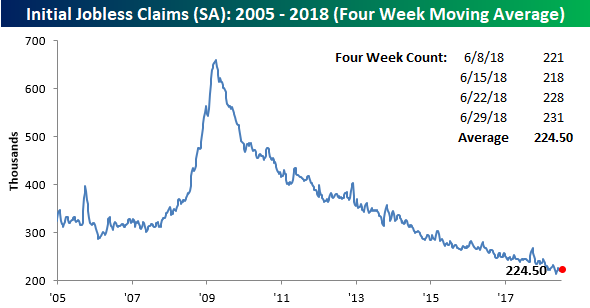
With two weeks in a row of higher claims readings, the four-week moving average is also drifting more and more from its multi-decade low of 213.5K from back in early May. At the current level of 224.5K, we wouldn’t expect to see this reading anywhere near a new low in the next several weeks.
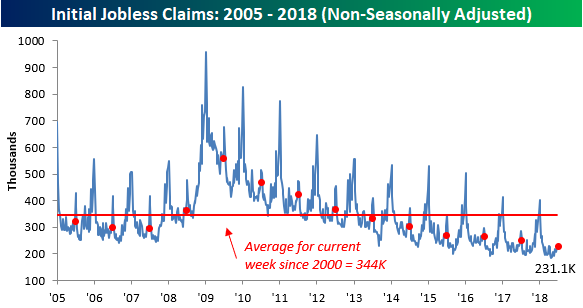
On a non-seasonally adjusted (NSA) basis, jobless claims ticked up to 231.1K from last week’s reading of 222.8K. Even with that increase, though, claims are more than 113K below the average of where they have been for this particular week of the year since 2000. In fact, the last time claims were lower in the current week of the year was back in 1973.
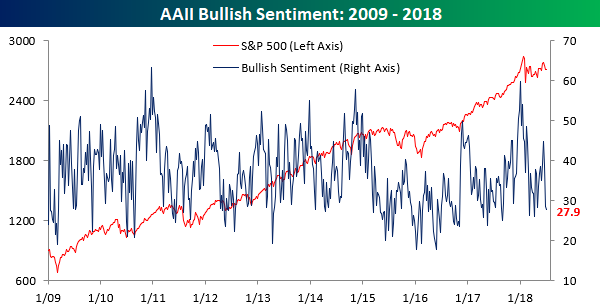
Little Change in Investor Sentiment
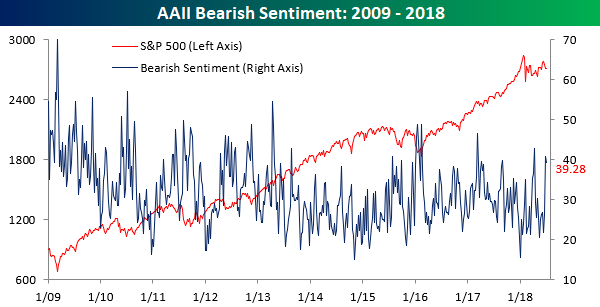
Given the July 4th holiday on Wednesday and the half day on Tuesday, there was very little change in investor sentiment over the last week. Based on the AAII survey, individual investors are still a lot more bearish than bullish. Bullish sentiment saw a slight decline on the week, falling from 28.5% down to 27.9%, which is the lowest level since early April.
Bearish sentiment, meanwhile, also saw a slight decline, falling from 40.8% down to 39.3%, but keep in mind that follows a massive 15 percentage point increase in the prior week.