Chart of the Day: Sector Breadth In Good Shape
Bespoke Market Calendar — July 2018
Please click the image below to view our July 2018 market calendar. This calendar includes the S&P 500’s average percentage change and average intraday chart pattern for each trading day during the upcoming month. It also includes market holidays and options expiration dates plus the dates of key economic indicator releases.

Cleaning Up Tariff Impacts
There’s a lot of discussion currently about how much impact new US tariffs on a variety of imports will have on the overall economy. For instance, many businesses in the ISM Manufacturing survey cited tariffs as a negative or cause for concern (link). The FOMC also noted “many District contacts expressed concern about the possible adverse effects of tariffs and other proposed trade restrictions” in its most recent meeting minutes. While overall tariff barriers are still very low versus much of history, the imposition of these new taxes (tariffs are a tax on a specific product) is already having effects.
At the end of January, the administration raised tariffs on both solar cells and washing machines sold to consumers (link). As a result, businesses ramped up imports ahead of the tariff’s introduction. Since 2008, no month had seen more than $185.4mm in washing machine imports. The average month was more like $129mm. In November, however, that number spiked to $223mm with over $310mm imported in December. The introduction of the tariffs in January led to a slower $188.4mm in imports before bottoming out at an anemic $66.1mm in March. We show these numbers (note: we’ve adjusted for seasonality) below.

The key takeaway from this data is that taxes change behavior. In some cases, changes in behavior can be small. In others, they can be large and temporary. Washing machines are a good example. From January to September of 2017, washing machine imports averaged $142.4mm/month. Since, they’ve averaged $155.6mm…but they’ve been extremely lumpy as businesses sought to avoid the tax. That sort of shift in the data is a good example of the effects on data that policy changes can have.
Of course, there are other impacts as well. After seeing 5 years of consistently declining prices, the CPI index for washing machines has surged 17.7% in the last two months as tariffs are passed on to consumers. As new tariffs continue to take effect, remember that they’re a tax hike, and that they can have complicated impacts on economic data which are sometimes hard to predict.
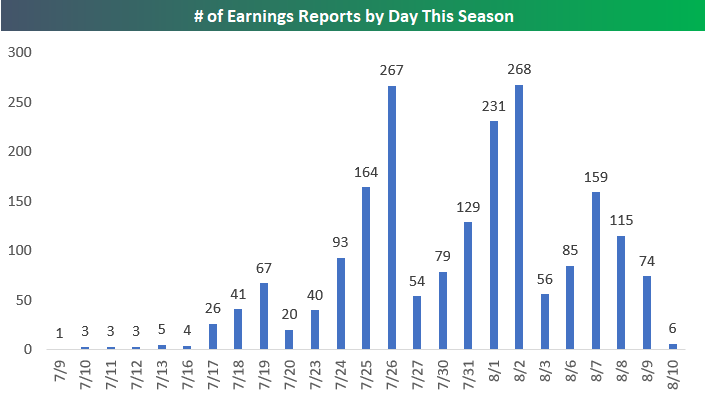
Bespoke’s Most Volatile Stocks on Earnings Ahead of Q2 Earnings Season
The 2nd quarter earnings reporting period is set to begin in earnest next week. Over the next month, roughly 2,000 public companies will release their Q2 results. While the calendar is relatively empty this week, things start to kick into gear next week as shown in the chart below. Starting with the week of July 23rd, investors will be deluged with dozens (and sometimes hundreds) of reports on a daily basis. The peak week for earnings season comes from July 30th through August 3rd when we hear from 763 companies. The peak day for earnings is Thursday, August 2nd when 268 companies will report.
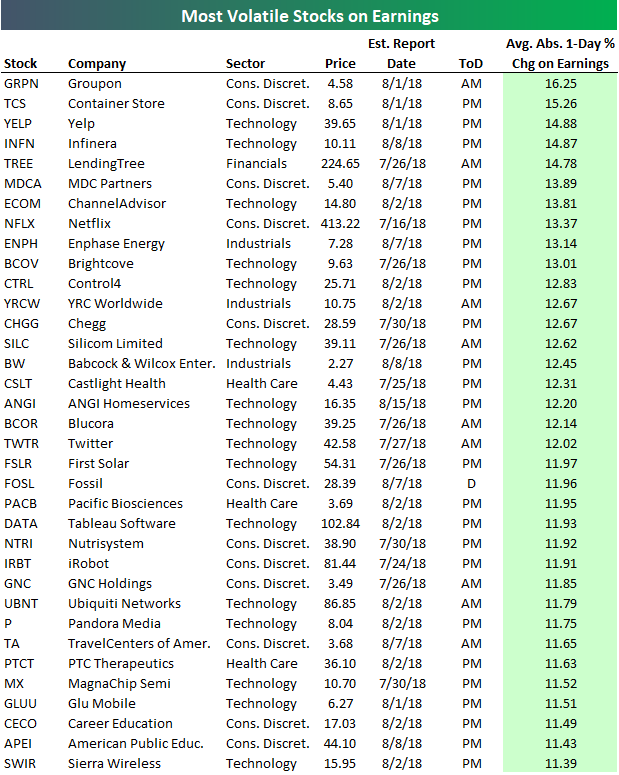
As we do ahead of each earnings season, below is our updated list of the most volatile stocks on earnings. These are the stocks that have historically experienced the biggest one-day stock price reactions (to the upside or downside) to their quarterly earnings reports. For a stock that reports earnings before the open of trading, we look at its change the next trading day. For a stock that reports earnings before the open, we look at that trading day’s change.
To make the list below, a stock must have at least 4 years worth of quarterly earnings reports (16 reports). It also must be set to report earnings between now and mid-August.
As shown, Groupon (GRPN) is the most volatile stock on earnings with an average absolute one-day price change of +/-16.25%. The Container Store (TCS) ranks as the second most volatile with an average one-day move of +/-15.26%. GRPN is set to report on the morning of August 1st, while TCS is set to report after the close on the same day.
Rounding out the top five are Yelp (YELP), Infinera (INFN), and LendingTree (TREE). Each of these stocks have historically moved at least 14% on their earnings reaction days. Other notables on the list include Netflix (NFLX) — which is by far the largest stock on the list — with an average one-day change of +/-13.37% on earnings, Twitter (TWTR), First Solar (FSLR), Nutrisystem (NTRI), iRobot (IRBT), Pandora (P), and Tableau Software (DATA).
For our most actionable earnings analysis, sign up for a Bespoke Institutional two-week free trial today.
B.I.G. Tips – Analysts Cautiously Pessimistic
Earnings season kicks off this week as the first of the major companies start to report Q2 numbers. Most of the big names reporting are Financials like Citigroup (C), JPMorgan Chase (JPM), PNC, and Wells Fargo (WFC), which all report on Friday morning. Besides these names, the only non-Financials of note are Pepsi (PEP) on Tuesday morning and Delta (DAL) before the open on Thursday.
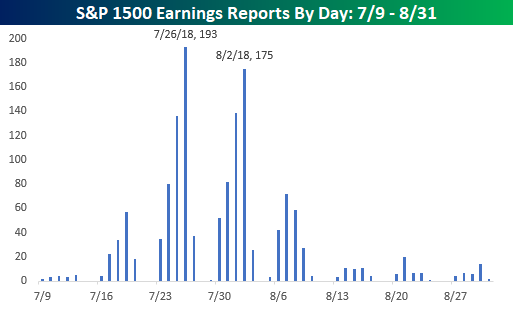
The pace of reports picks up next week when 135 companies in the S&P 1500 are expected to report, but the peak period of earnings season will be in the two weeks that follow as more than 950 companies are scheduled to report. That’s nearly two-thirds of the entire index in just two weeks! The busiest day during that period will be on 7/26 when 193 companies in the S&P 1500 are expected to report in a single day, while the second busiest day of earnings season is one week later on 8/2 when another 175 companies will report. For a more detailed rundown of the earnings schedule for the upcoming season, please see our Interactive Earnings Calendar, and to prepare for how individual companies tend to react to earnings, check out our Earnings Screener (available to all Institutional clients).
We just published our quarterly look at analyst EPS revisions heading into this earnings season. In this report, we look to see if analysts are bullish or bearish on earnings for the upcoming quarter. Analyst sentiment at the start of earnings season has historically had a big impact on the stock market’s performance.
This report is a must-read. To see it, sign up for a Bespoke Premium membership now!
Bespoke Brunch Reads: 7/8/18
Welcome to Bespoke Brunch Reads — a linkfest of the favorite things we read over the past week. The links are mostly market related, but there are some other interesting subjects covered as well. We hope you enjoy the food for thought as a supplement to the research we provide you during the week.
Research
How Much Americans Could Save by Ridesharing Driverless Cars Over Owning (Insurance Journal)
While self-driving cars are still far from deployment and uptake is likely to be a very, very long and slow process (please see our Industry Insight on the subject, link), they do have the potential to save drivers a huge amount of money over traditional ownership. [Link]
The World Cup, Nationalism, and International Trade by Andrew Bertoli and George Yin (SSRN)
Using data from the group stage of the World Cup from 1930 to 2014 (486 matches), the authors identify a measurable decline in trade between soccer match contestants in time periods close to the games. [Link]
Investing
Vanguard Will Let Investors Trade Its Rivals’ Funds Online for Free by Lisa Beilfuss (WSJ)
In order to drive more customer traffic, Vanguard’s rival products will now be commission free for Vanguard investors. [Link; paywall]
China
PBOC Says China’s Fiscal System Reason Behind Its Leverage Woes (China Banking News)
The head of the PBoC’s research department argued recently that distortions in China’s tax and fiscal systems have created excessive credit problems for the country. [Link]
Family
Americans Are Having Fewer Babies. They Told Us Why. by Claire Cain Miller (NYT)
Using a poll of 20-45 year olds, the Upshot team identifies economic issues as the biggest factors holding back fertility rates among the current cohort in prime parenthood ages. [Link]
The Secret Price of Pets by Peter Haldeman (NYT)
Fake testicles, insurance, plastic surgery, gender reassignment, and obscure hair-dos: these are just some of the obscure services pet owners are purchasing these days. [Link; soft paywall]
Online Dystopia
The nightmare videos of children’s YouTube — and what’s wrong with the internet today by James Bridle (TED)
In our Brunch Reads dated November 17th (link), we included a story about the nightmarish content that finds its way into the YouTube feeds of children via the algorithmic recommendations provided by the service (link). That original piece is now a TED talk. [Link]
“I Was Devastated”: Tim Berners-Lee, the Man Who Created the World Wide Web, Has Some Regrets by Katrina Brooker (Vanity Fair)
The man most plausibly credited with inventing the internet is deeply troubled with where his work has taken the world, but he has ideas about how to improve things. [Link; soft paywall]
Juggalos Figured Out How To Beat Facial Recognition by Caroline Haskins (The Outline)
Insane Clown Posse fans are an odd bunch, and their trademark clown makeup has inadvertently demonstrated a weapon against facial recognition technology. Can we get a whoop-whoop? [Link]
Real Estate
Tax h(e)aven by Ina Cordle and Katherine Kallergis (The Real Deal)
Responding to new incentives created (intentionally, in an effort to reduce blue state fiscal capacity) by the tax cuts introduced last year, ultra-wealthy buyers are bidding up South Florida real estate. [Link]
Manhattan real estate has worst second quarter since financial crisis by Robert Frank (CNBC)
Not-so-surprisingly based on the prior link, Manhattan high-end real estate has gotten hit hard, with sales down 17% and prices off 5% on average. [Link]
The Death of a Once Great City by Kevin Baker (Harpers)
Development, especially with towering new buildings in central cores, is in this author’s view wrecking the diverse, dynamic tumble that was once the hallmark of American cities. [Link]
Slow Adoption
Even Great Ideas Can Fail At First. Just Look At The Zipper. by Marc Bain (Quartzy)
Americans alone consume 4.5 billion zippers per year, but the story of its development is a very long one with a range of patents running from 1853 to 1917 before a zipper we would recognize today was created. [Link]
Sports
Inside Decision 3.0: LeBron James Follows in the Footsteps of Legends by Lee Jenkins (SI)
The story of how Lebron James landed in Los Angeles in a surprise move that capped off weeks of speculation from the sports world about where the best basketball player of his generation (and, probably, ever) would wind up. [Link; auto-playing video]
Nathan’s might go digital after awful hot dog judging flub by Noah Bressner and Chris Perez (NYP)
Judges at the iconic American eating contest on the 4th of July badly flubbed the count as eleven time winner Joey Chestnut set a world record. [Link]
SCOTUS
Inside the White House’s Quiet Campaign to Create a Supreme Court Opening by Adam Liptak and Maggie Haberman (NYT)
How the Trump White House worked to convince Justice Kennedy to retire, creating a second vacancy on the Supreme Court for the administration to fill. [Link]
Read Bespoke’s most actionable market research by starting a two-week free trial today! Get started here.
Have a great Sunday!
The Closer: End of Week Charts — 7/6/18
Looking for deeper insight on global markets and economics? In tonight’s Closer sent to Bespoke clients, we recap weekly price action in major asset classes, update economic surprise index data for major economies, chart the weekly Commitment of Traders report from the CFTC, and provide our normal nightly update on ETF performance, volume and price movers, and the Bespoke Market Timing Model. We also take a look at the trend in various developed market FX markets.
Below is a snapshot from today’s Closer highlighting weekly intraday price charts for major equity indices and other asset classes. If you’d like to see more, start a free trial below.

The Closer is one of our most popular reports, and you can sign up for a free trial below to see it!
See tonight’s Closer by starting a two-week free trial to Bespoke Institutional now!
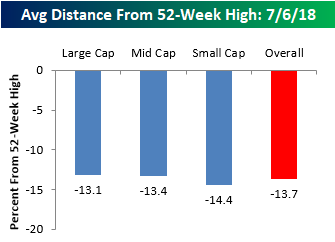
Bespoke’s Sector Snapshot — 7/6/18
We’ve just released our weekly Sector Snapshot report (see a sample here) for Bespoke Premium and Bespoke Institutional members. Please log-in here to view the report if you’re already a member. If you’re not yet a subscriber and would like to see the report, please start a two-week free trial to Bespoke Premium now.
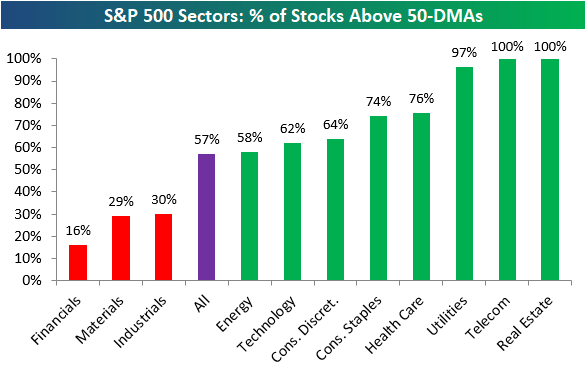
Below is one of the many charts included in this week’s Sector Snapshot, which shows the percentage of stocks in each sector that are trading above their 50-day moving averages. This is a popular measure of breadth. As shown, eight sectors currently have stronger readings than the S&P 500, while just three have weaker readings.
To find out what this means and to see our full Sector Snapshot with additional commentary plus six pages of charts that include analysis of valuations, breadth, technicals, and relative strength, start a two-week free trial to our Bespoke Premium package now. Here’s a breakdown of the products you’ll receive.
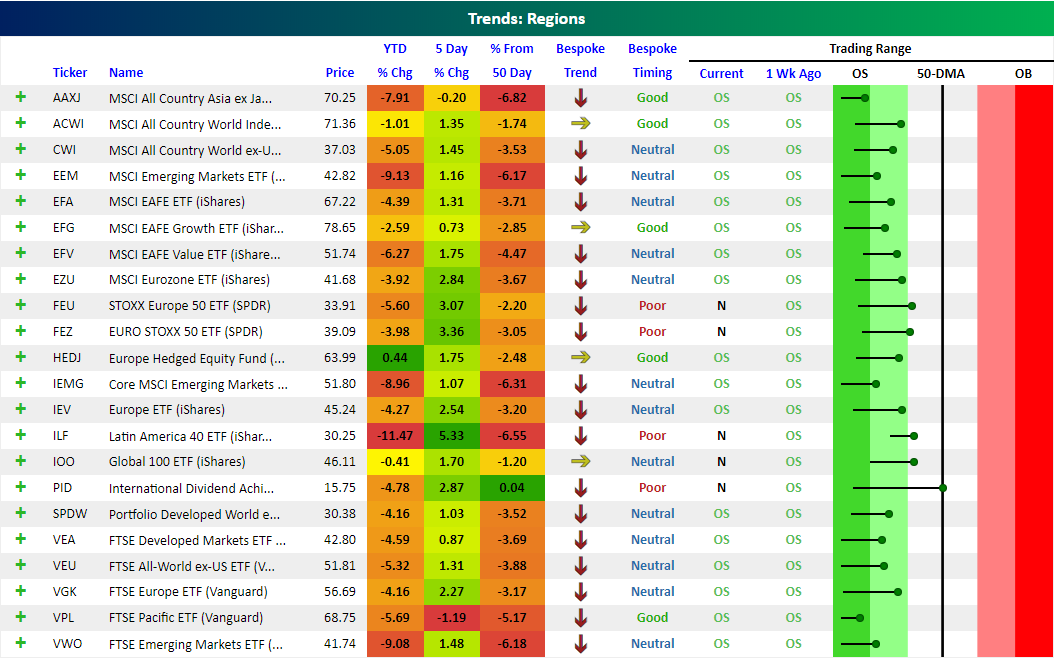
Oversold Bounce for Global Equity Markets
Our Trend Analyzer (available to Bespoke Premium and Bespoke Institutional members) highlights how stocks and ETFs are trending and how overbought or oversold they are from a timing perspective. It’s a very useful way to quickly analyze the health of a specific portfolio or any basket of stocks and ETFs.
Below is a snapshot of our Trend Analyzer showing regional ETFs that cover equity markets around the world. You can see that most of these ETFs are down YTD and below their 50-day moving averages, but they have bounced over the last 5 trading days. On the right side of the snapshot, the dot for each ETF represents where it’s currently trading relative to its 50-day moving average (the black, vertical “N” line). The tail end of the dot represents where it was trading a week ago. When the dot is in the green zone, the ETF is “oversold” relative to its normal trading range, while a dot in the red zone means the ETF is “overbought.”
Last week at this time, every single regional ETF shown was in oversold territory, with many at extreme levels (the dark green section). Over the last week, though, we’ve seen a big bounce off of oversold levels, as evidenced by the long tails with the dots to the right of the tails. Stocks globally remain in longer-term downtrends, but at least they’ve caught a bid over the last week. Bulls are hopeful this is the start of a meaningful rally.
Poor Pulse
Each month, Bespoke Market Intelligence publishes a comprehensive review of the US consumer called Bespoke Consumer Pulse. In the June report, we saw a number of negative indicators after a very strong run for the consumer over the past 18 months or so. You can access the whole report by signing up for a free 30-day trial. Pulse surveys ~1500 US consumers on a monthly basis, providing tracking for consumer activity, confidence, and their relationship with businesses.
One indicator we like to keep track of is consumers’ assessment of their financial condition relative to what they perceive as the “average” person. As shown in the chart below, after surging from mid-2015 to mid-2017, the indicator has persistently softened over the past year or so. That’s a sign that consumers may be feeling less confident in their financial situations and falling behind their peers.

Another negative signal from our data is the assessment that consumers make of their income growth. The chart below shows our composite indicator for how respondents feel about their personal income growth. As shown, it took a significant tumble MoM in June from very strong levels. One-off declines of that kind have precedents, but it’s still a very significant drop and a trend to keep an eye on.

While not a direct economic variable, we also keep track of the share of consumers reporting they have health insurance. That number drifted slowly higher from 2014 through 2017 but has since started to slide, hitting the lowest level in years in our June data. This could be a factor in how confident about their personal finances our respondents are feeling.

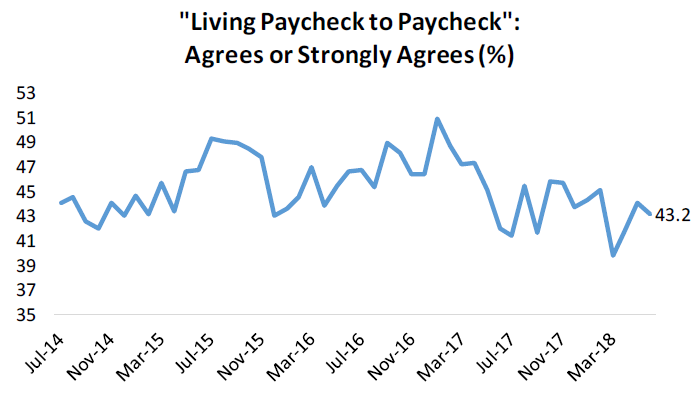
Finally, some less negative news. As shown in the chart below, the share of respondents who report they are living paycheck to paycheck (a measure of economic insecurity, or perceived economic insecurity) has steadily fallen since late 2016. While this series is a bit elevated from recent levels, it’s still trending lower which is one positive take-away from our survey.
Finally, we’ll take a look at stock-specific insight from our survey. Since late 2015, “core” Facebook has been seeing steady declines in the share of consumers reporting it as one of their two most frequent social media sites. Fortunately for the stock, Instagram has seen steadily rising popularity that has offset much of the usage decline from the core product. Remember, if you aren’t already a subscriber to our Pulse add-onn service, you can access the whole report by signing up for a free 30-day trial.